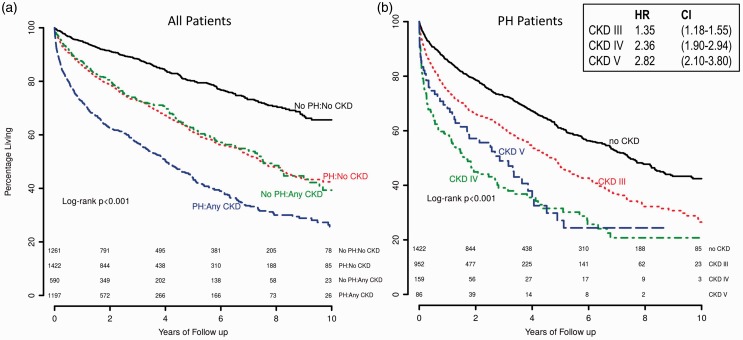
Fig. 4.
Survival according to CKD and PH status. (a) Kaplan–Meyer curves of unadjusted mortality in years based on the presence or absence of PH and any degree of CKD. The number at risk is displayed beneath the curves. (b) Kaplan–Meyer curves of unadjusted mortality in years among PH patients based on the presence or absence of CKD III or CKD IV/V. The number at risk is displayed beneath the curves. Adjusted HRs and 95% CIs for CKD stages III–V are shown in the box. Full multivariate analysis with all covariates displayed in Fig. 5.

