
Figure 3.
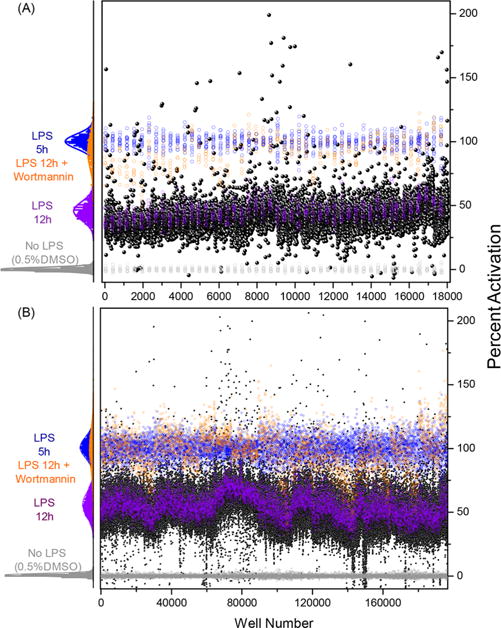
Pilot and HTS main screen. Percent activation values for the controls and test compounds from (A) the pilot screen and (B) the main screen. The histogram plot to the left for each screen shows the intra-assay statistics on the percent activation values for No LPS (0.5% DMSO, negative control), LPS 12 h (100 ng/mL LPS control added at time 0 h), LPS 12 h + wortmannin (positive control), and LPS 5 h (100 ng/mL LPS control added 5 h before the assay read out). The scatter plot to the right shows percent activation values for all the compounds and controls used in each screen. Each black circle represents an individual test compound, while controls are colored as in the histogram plot.