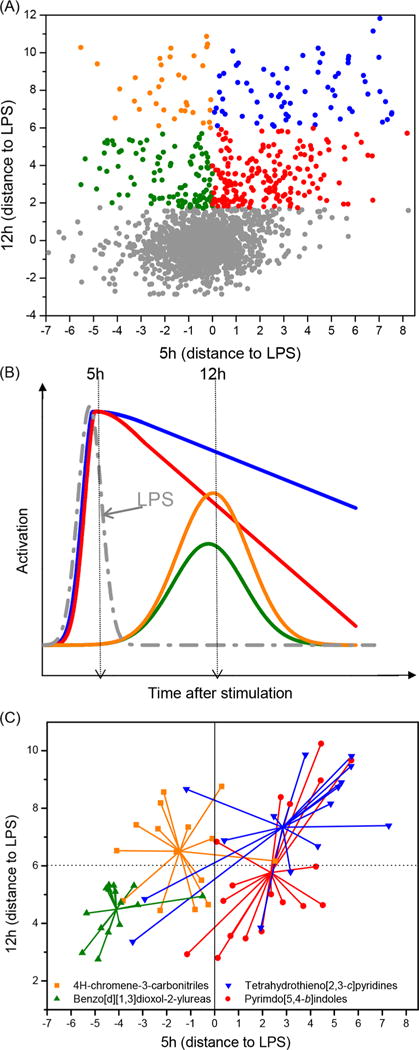
Figure 4.

Confirmation and kinetic profile screens. (A) A scatter plot of distance to LPS values for 2011 compounds selected for confirmation and kinetic profile screens. The abscissa values correspond to the kinetic profile experiment while the ordinate values correspond to the confirmation screen experiment. (B) The compounds were divided into four categories based on their theoretical kinetic profiles for NF-κB activation with LPS. These compounds were either early inhibitors (5 h distance to LPS < 0) or early enhancers (5 h distance to LPS > 0). Within the early inhibitors, the compounds were grouped as either showing a moderate increase or high increase in NF-κB induction compared to LPS at 12 h (green and orange symbols and lines, respectively). Similarly, within the enhancer groups, compounds showed a moderate or high increase in NF-κB induction compared to LPS at 12 h (red and blue symbols and lines, respectively). (C) Cluster binning of confirmed hits indicates segregation of chemotypes into distinct kinetic profiles. Large clusters were colored based on chemotype, namely pyrimido[5,4-b]indoles (red circles), tetrahydrothieno[2,3-c]pyridines(blue triangles), benzo-[d][1,3]dioxol-2-ylureas (green triangles), and 4H-chromene-3-carbonitriles (orange squares). The center of the chemotype cluster was calculated as the geometric mean of the coordinates within a cluster. The colors are consistent with the kinetic profiles shown in B.
