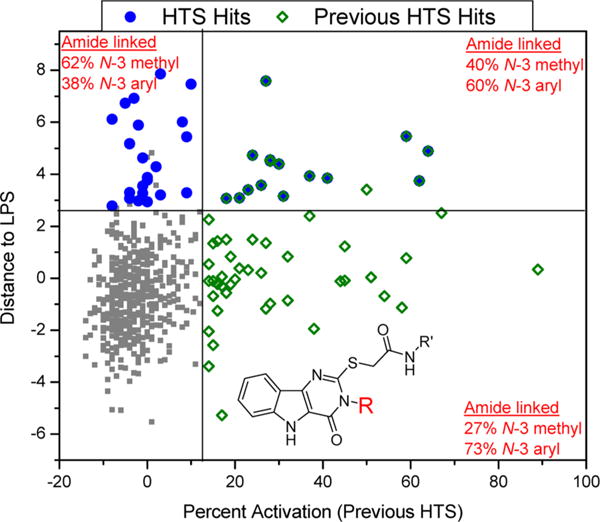
Figure 5.

NF-κB activation data for pyrimidoindoles from two different HTS campaigns. A scatter plot of “distance to LPS” values from the current HTS on the Y axis and “percent activation” values from the previous HTS on the X axis for all the pyrimidoindoles shows clearly the distinct structural attribute for the C2–S-methylene acetamide linked molecules. The blue circles represent the hits identified in the current HTS campaign, while the green squares represent the hits identified in the previous HTS. The N3-aryl substituted pyrimidoindoles show intrinsic NF-κB activity while N3-methyl substituted pyrimidoindoles tend to prolong initial NF-κB activation by LPS without any intrinsic NF-κB activation.
