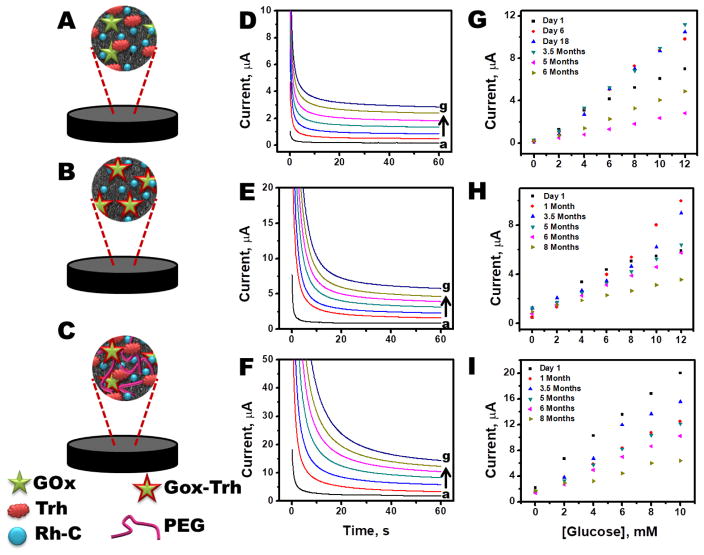
Fig. 3.
(A) Schematic illustrating different components of pellet composition (A) P1, (B) P2 and (C) P3. Typical chromoamperometric response for increasing concentration of glucose for (D) P1, (E) P2 and (F) P3. Calibration plots acquired during stability of study for (G) P1, (I) P2 and (J) P3. In all cases highest R.S.D. <=15%. (Reviewer #1; Comment #2)

