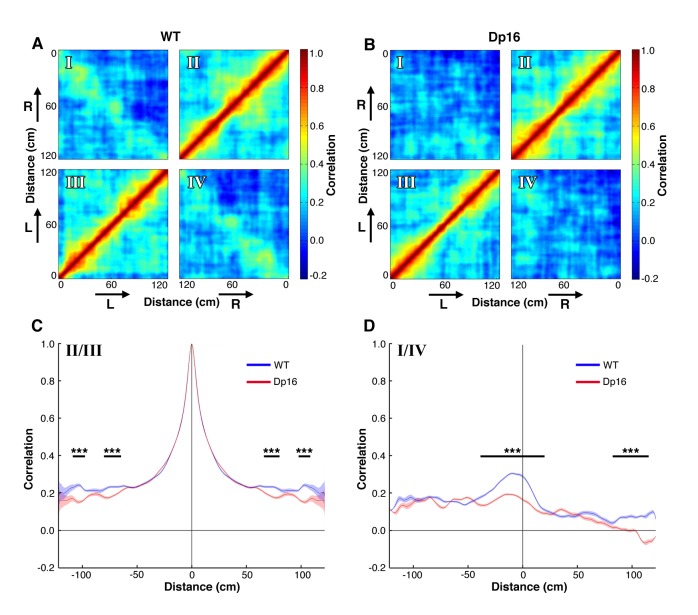
Figure 2. Population level coding of position is altered in Dp(16)1Yey mice.
(A) Spatial autocorrelation matrix of the population vectors in WT mice. Lower left (III) and upper right (II) quadrants represent the correlation of population vectors encoding movements in the same direction. Upper left (I) and lower right (IV) quadrants represent the correlation for opposite directions. Arrows indicate the movement direction (L: left laps; R: right laps). (B) Spatial autocorrelation matrix of the population vectors in Dp(16)1Yey mice. (C) Average correlation as a function of track distance for population vectors encoding movement in the same direction. The blue and red lines represent average values of the quadrants II and III of the cross-correlation matrices displayed on panels A and B respectively. The shaded areas correspond to the standard error of mean (S.E.M) of these values. The dominant central peak indicates a strong positional encoding independent from the location of the place fields in the track, in both WT and Dp(16)1Yey mice. (D) Same as in (C) for population vectors encoding movements in opposite direction, averaged across quadrants I and IV of the cross-correlation matrices shown on panels A and B.. The peak in the center indicates a mild correlation in the encoding of the animal’s position between movements in opposite directions in the WT group. Dp(16)1Yey mice however failed to show a similar pattern. Statistical significance was assessed using Wilcoxon ranksum test with significance set at (***) p<0.001.

