. 2018 Feb 27;7:e31543. doi: 10.7554/eLife.31543

Figure 4. Decreased activity of CA1 pyramidal cells during ripple events in Dp(16)1Yey mice.

(A) Examples of local field potentials (LFP), non-filtered (upper traces) or filtered for the ripple frequency range (lower traces). The occurrence of ripple events (B), the inter-ripple interval (C) and the peak ripple frequency (D) were not significantly different between Dp(16)1Yey and WT mice. Ripple amplitude (E) and duration (F) were significantly decreased in the LFPs of Dp(16)1Yey mice. The number of spikes per cell per ripple (G) and the participation of individual cells in ripple events (H) were significantly lower in CA1 pyramidal cells of Dp16 mice. (I) The proportion of cells plotted as a function of their participation rate in sharp-wave ripples showed a significant shift toward lower participation rates, with Dp(16)1Yey pyramidal cells peaking at 5–10% participation whereas the peak was at 10–15% in the WT group. Each marker in (B) thru (F) represents average value from all events in an individual mouse. The origin of the Y-axis in D, E and F was set at the threshold used for ripple detection. Statistical significance was assessed using one-way ANOVA (B–F) or Mann-Whitney U-test (G, H) with significance set at (*) p<0.05 and (**) p<0.01.

Figure 4—source data 1. Sharp wave ripples analysis - full data set.
DOI: 10.7554/eLife.31543.015

Figure 4.

Figure 4—figure supplement 1. Sharp wave ripple peak frequency was not significantly affected in Dp(16)1Yey mice.

Figure 4—figure supplement 1.

The population distribution of sharp wave ripples was plotted according to their intrinsic peak frequency for all WT (blue; N = 5, n = 4541 ripples) and Dp(16)1Yey (red; N = 6, n = 6034 ripples) mice. A mild shift toward events of lower frequencies was observed in Dp(16)1Yey mice, but this did not reach the level of significance (Kolmogorov-Smirnov test for normality: p=0.6403, k = 0.1714).
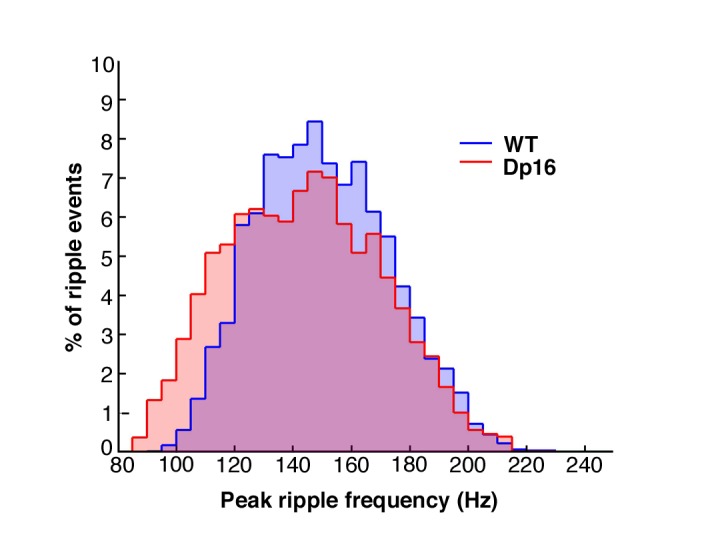
Figure 4—figure supplement 2. Decreased activity of CA1 pyramidal cells during ripple events in Dp(16)1Yey mice is not related to ripple amplitude.

Figure 4—figure supplement 2.

(A) Compared to the standard detection threshold (commonly placed at 3 SD), using a more permissive threshold (2 SD) led to a larger number of ripples detected in both WT and Dp16 mice. The frequency of occurrence of ripple events was significantly higher in Dp16 than their WT littermates. On the contrary, using a more restrictive threshold (6 SD) decreased the amount of ripples detected in both genotypes to similar low levels. (B) The number of spikes per cell per ripple and the participation of individual cells in ripple events were significantly lower in CA1 pyramidal cells of Dp16 mice even when ripple events were detected using a more permissive threshold (2 SD). A similar effect was seen using a more restrictive threshold (6 SD), even though the decrease in participation rate in Dp16 mice did not reach the significance level. Using either the more restrictive or more permissive threshold for the detection of ripples, the proportion of cells plotted as a function of their participation rate in sharp-wave ripples confirmed a significant shift toward lower participation rates in Dp16 mice. Statistical significance was assessed using one-way ANOVA (A) or Mann-Whitney U-test and chi square text (B) with significance set at (*) p<0.05, (**) p<0.01 and (***) p<0.001.
Figure 4—figure supplement 3. Decreased activity of CA1 pyramidal cells during ripple events in Dp(16)1Yey mice is not related to ripple detection bias.

Figure 4—figure supplement 3.

Onset and offset of ripple events were detected using the underlying multiunit activity in order to prevent a bias eventually caused by the amplitude of these events in Dp16 mice. The number of ripples per minute (A), inter-ripple interval (B) and peak power spectrum density frequency of ripple events were not significantly different between Dp16 and WT littermates. Their amplitude (D) and duration (E) were however significantly decreased in the Dp16 group. The number of spikes per ripple (F) and participation in ripple events (G) were significantly lower in Dp16 mice. (H) The proportion of cells plotted as a function of their participation rate in sharp-wave ripples showed a significant shift toward lower participation rates, with Dp(16)1Yey pyramidal cells peaking at 5–10% participation whereas the peak was at 10–15% in the WT group. Each marker in (A) thru (E) represents average value from all events in an individual mouse. Statistical significance was assessed using one-way ANOVA (A–E) or Mann-Whitney U-test (F, G) with significance set at (*) p<0.05 and (**) p<0.01 and (***) p<0.001.