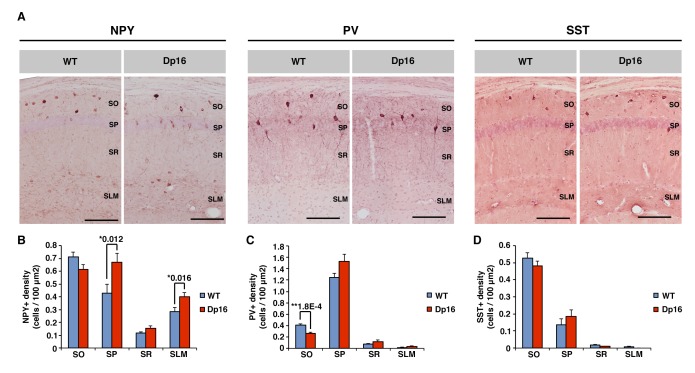
Figure 5. Neuropeptide Y-positive interneuron density is increased in the CA1 of Dp(16)1Yey mice.
(A) Anti-neuropeptide Y (NPY), anti-parvalbumin (PV) and anti-somatostatin (SST) immunochemistry allow the visualization of specific populations of interneurons within the stratum oriens (SO), stratum pyramidale (SP), stratum radiatum (SR) and stratum lacunosum moleculare (SLM) of the CA1 area of hippocampus. (B) The density of NPY positive cells was significantly increased in the SR and SLM of Dp(16)1Yey mice. (C) The density of PV positive neurons was significantly decreased in the SO of Dp(16)1Yey mice, but remained comparable to WT in the SP where the majority of the PV positive cells are found. (D) The density of SST positive neurons was not significantly different between Dp(16)1Yey and WT samples in all four layers of the CA1. Values are expressed as mean ±standard error of the mean. Statistical significance was assessed using Mann-Whitney U-test (B–D) with significance set at (*) p<0.05 and (**) p<0.01. Scale bars in (A) correspond to 50 μm.

