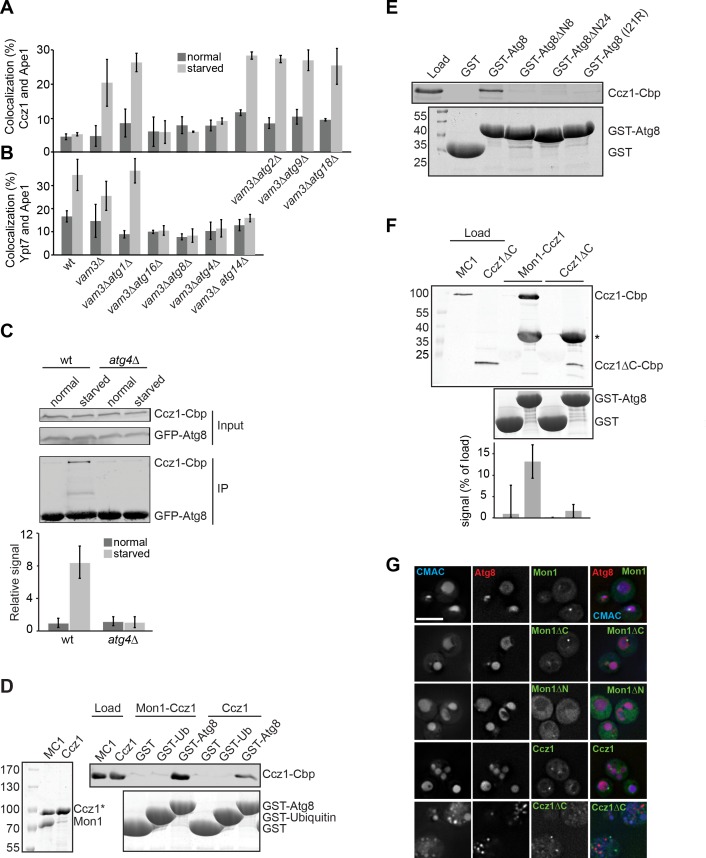
Figure 2. Atg8 binds to Mon1-Ccz1 via the Ccz1 C-terminal part.
(A–B) Atg8 is required for localization of Ccz1 to autophagosomes. Graphs show percentage of colocalization of Ccz1 puncta (A) or Ypt7 puncta (B) relative to Ape1 puncta in wild-type and the different mutants. Cells were grown and analyzed as in Figure 1. Ape1 dots (n ≥ 50), Ccz1 dots (n ≥ 300), and Ypt7 dots (n ≥ 200) were quantified by Image J. Error bars represent SD. (C–E) Interaction analysis of Atg8 with Mon1-Ccz1. (C) Immunoprecipitation of TAP-tagged Ccz1 from wild-type and atg4∆ strain co-expressing GFP-Atg8. The strain was grown in YPD or in SD-N for 3 hr before preparing cell extracts. GFP-Atg8 was subsequently immunoprecipitated using GFP-trap beads. Finally, immunoprecipitates were analyzed by Western blotting against GFP and CbP-tag. The graph is the quantification of three independent experiments, where the interaction observed in unstarved cells from wild-type is set as 1. Error bars are SD. (D) Interaction of Atg8 with Mon1-Ccz1 or purified Ccz1. TAP-tagged proteins (shown as purified proteins on Coomassie stained gels to left) were incubated with GST, GST-ubiquitin, and GST-Atg8 immobilized on GSH-Sepharose. Eluted proteins were resolved by SDS-PAGE and analyzed by Western blotting against the CbP-tag (top) or by Coomassie staining (bottom). Load, 10%. (E) Interaction of Atg8 mutants with Mon1-Ccz1. Analysis was done as in (D) with the indicated GST-tagged Atg8 truncation mutants. (F) Interaction of Mon1-Ccz1∆C with Atg8. Mon1-Ccz1∆C was purified as wild-type and analyzed for interaction with GST-tagged Atg8 as before. Top, Western blot against the CbP tag. A star indicates the additional decoration of GST-Atg8 by the antibody; bottom, Coomassie staining and quantification of three experiments. (G) Requirements of Mon1 and Ccz1 domains for autophagy. The indicated truncations were analyzed in cells expressing mCherry-tagged Atg8. Vacuoles were stained with CMAC, and cells grown in SD-N medium were then analyzed by fluorescence microscopy as in Figure 1B. Size bar, 5 µm.
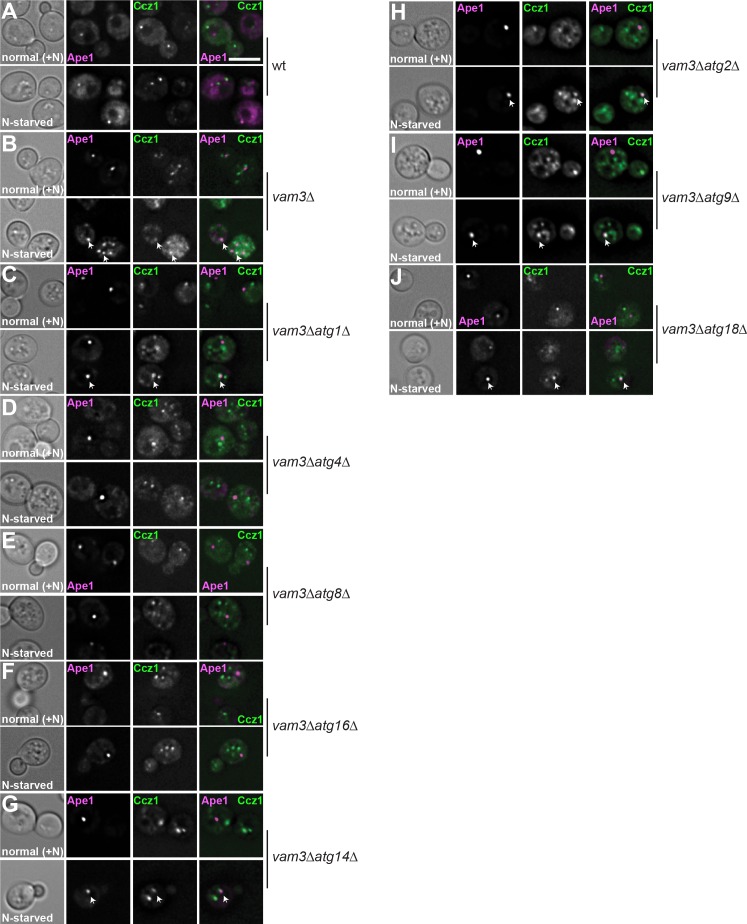
Figure 2—figure supplement 1. Ccz1 fails to localize to autophagosomes during starvation in mutants that lack Atg8 or the conjugation system.
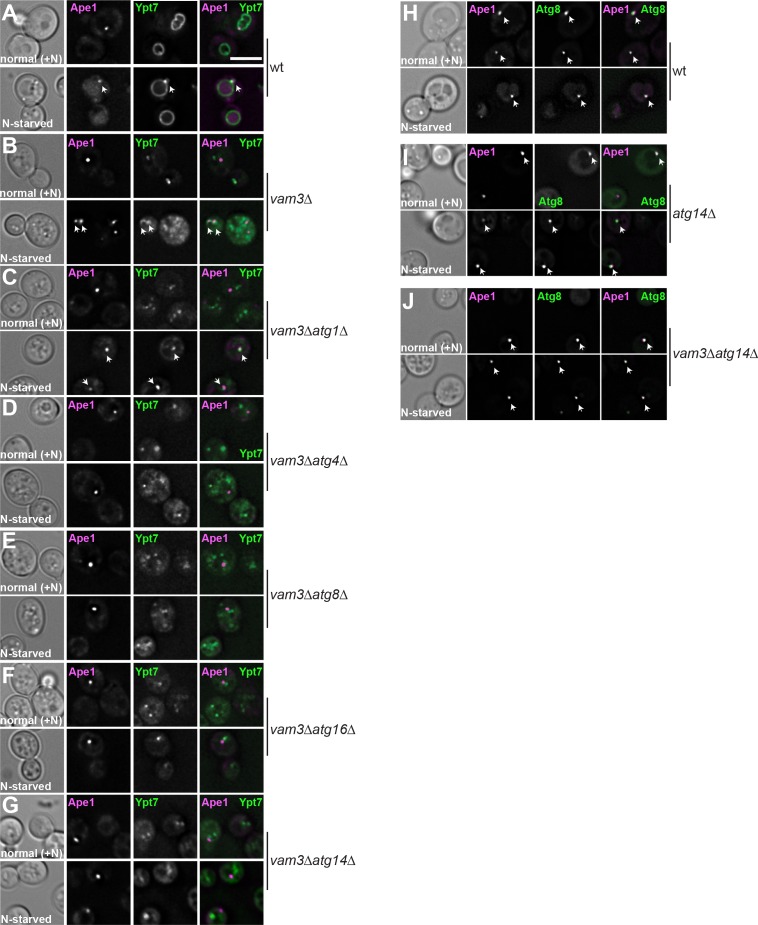
Figure 2—figure supplement 2. Analysis of Ypt7 and Atg8 localization relative to Ape1 in wild-type and mutant strains.
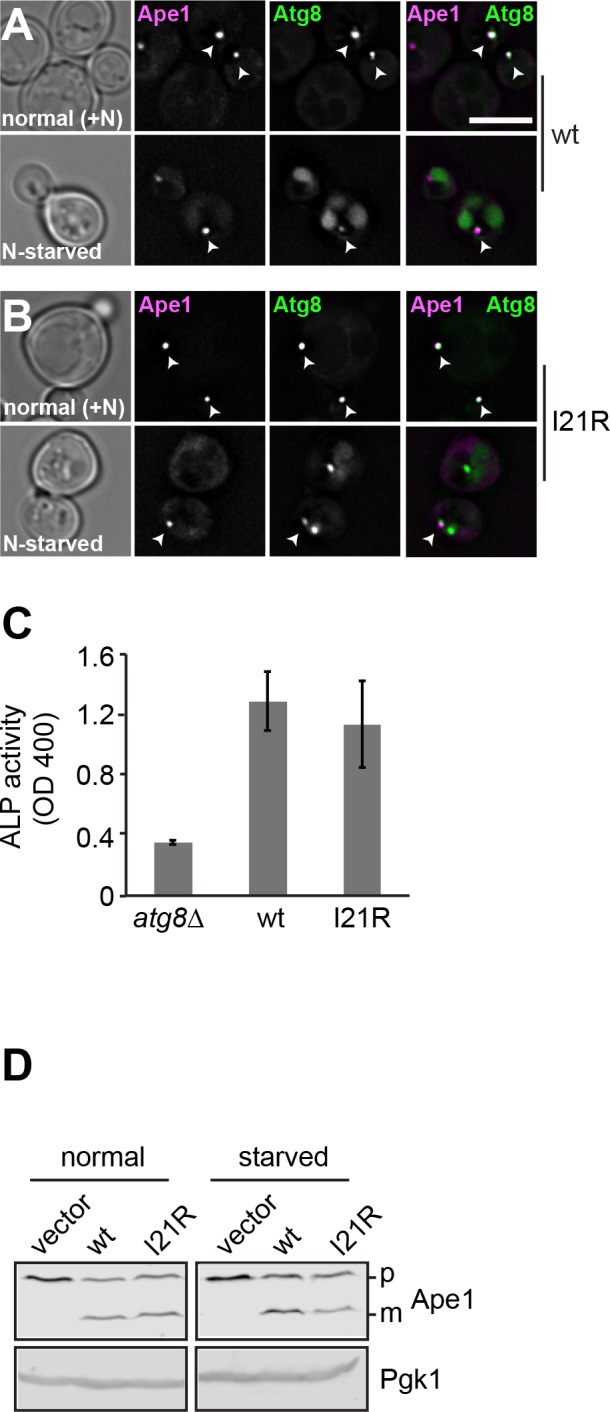
Figure 2—figure supplement 3. The Atg8 I21R mutant shows impaired selective autophagy.


