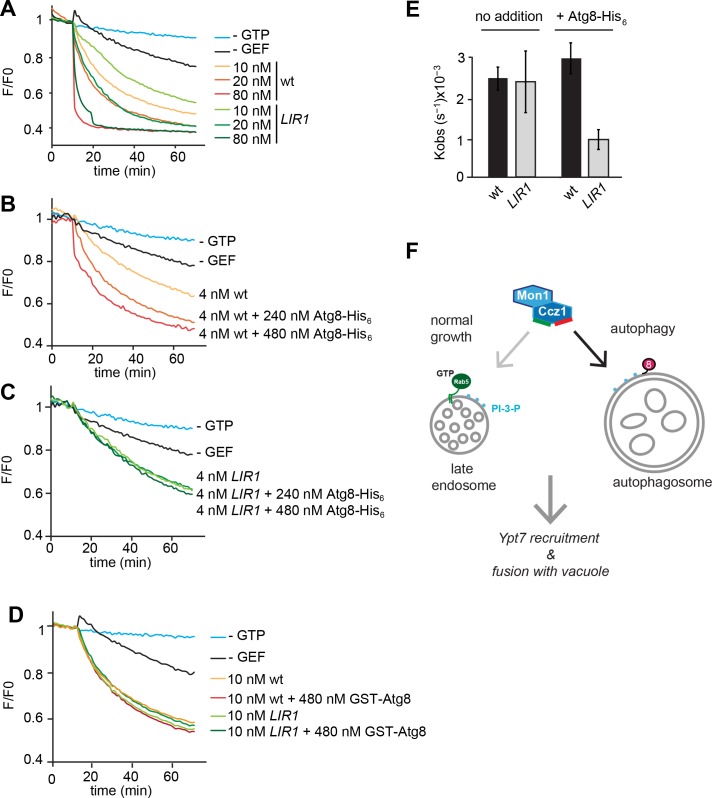
Figure 5. Functional reconstitution of Atg8-dependent GEF activity of Mon1-Ccz1.
(A) GEF activity of wild-type and mutant Mon1-Ccz1 complex. GEF activity was monitored by displacement of MANT-GDP from Ypt7 using a microplate reader (see Materials and methods). Assay was carried out with liposomes capable of binding His-tagged Ypt7 (Cabrera et al., 2014). Without GTP, blue line; without GEF, black line; wt refers to different concentrations of Mon1-Ccz1, LIR1 to the Mon1-Ccz1 mutant complex. (B–D) Effect of membrane-bound Atg8 or soluble Atg8 on GEF activity. Analysis was carried out as in (A) with reduced Mon-Ccz1 concentrations and upon addition of His-tagged Atg8 at the indicated concentrations. (E) Quantification of the rate constants of wild-type and mutant Mon1-Ccz1 complex in the presence and absence of Atg8 for Figure 5B–C. Rate constants were calculated based on the initial slope of the GEF curve (n = 3) (Kiontke et al., 2017; Langemeyer et al., 2014). Error bars, SD. (F) Model of Mon1-Ccz1 recruitment to the autophagosome and endosomes. For details see text.

