
Fig. 4.
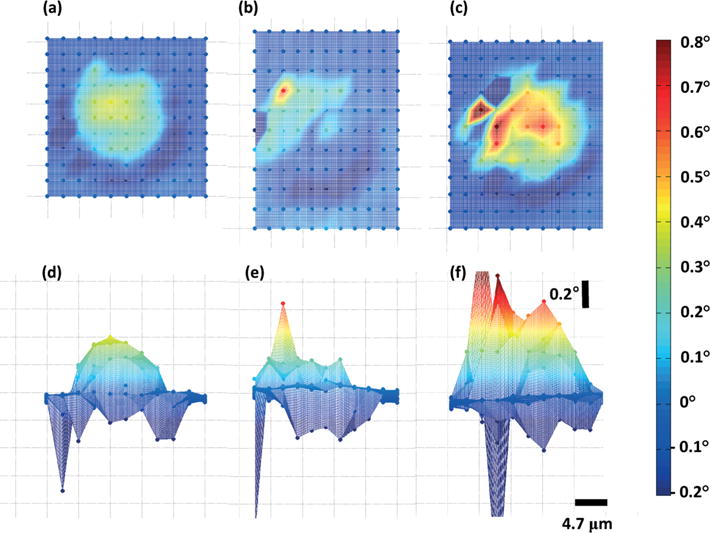
Scanning measurement of the cells with different treatment. (a and d): Top and side views of the fresh and live cell. (b and e): Top and side views of the cell whose stiffness was increased by chemical fixation. (c and f): Top and side views of the cell whose stiffness was decreased by nocadazole and cytochalasin D treatment.