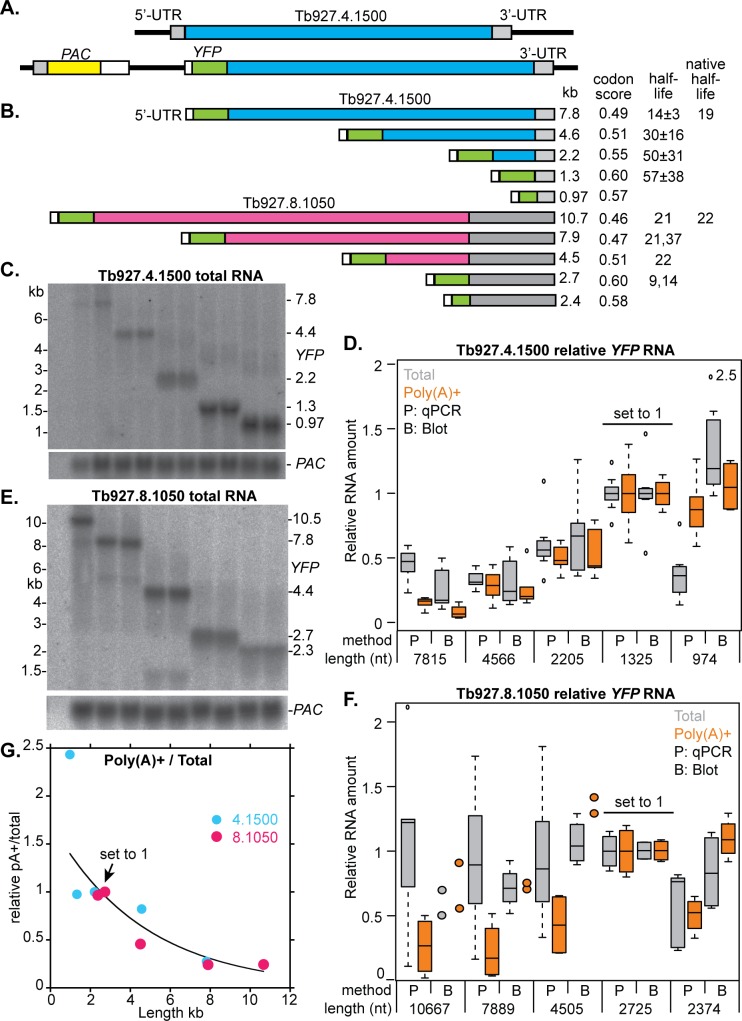
Fig 5. Reporter experiments: Effect of mRNA length on poly(A) selection and mRNA abundance.
A. Cartoon of an intact Tb927.4.1500 locus (above) and a locus with integrated PAC-GFP (not to scale). B. Structures of GFP fusion mRNAs (to scale) with lengths. The codon optimality scores are calculated using a formula provided by Prof. M. Carrington (Cambridge University, personal communication). Approximate half-lives were estimated by real-time PCR of mRNA prepared 30 min after addition of Actinomycin D; each clone was measured once. C. Sample Northern blot for Tb927.4.1500; other blots are in S4D Fig. Amounts of GFP signal or PCR product relative to the result for the 1.3 kb mRNA. The boxes indicate the median value with 25th and 75th percentiles; whiskers extend to the most extreme data point that is no more than 1.5 times the length of the box away from the box. Tiny circles are outliers. E. Sample Northern blot for Tb927.8.1050; other blots are in S3F Fig. Amounts of GFP signal or PCR product relative to the result for the 2.7 kb mRNA. If less than 4 measurements were available, individual results are shown as coloured circles. G. Ratio of poly(A)+ to total mRNA. To make the values for the two genes comparable, the abundances of the Tb927.4.1500 reporter mRNAs were calculated relative to the 2.2 kb mRNA. (This results in exclusion of one dataset that lacks a value for that length.) The average relative mRNA abundance in poly(A)+ was divided by the relative abundance in total RNA. Results using medians were similar. The exponential curve was calculated in Kaleidograph using the combined data from both genes.

