
Fig. 2. Glioblastoma EVs contain PD-L1 and block TCR-mediated T cell activation.
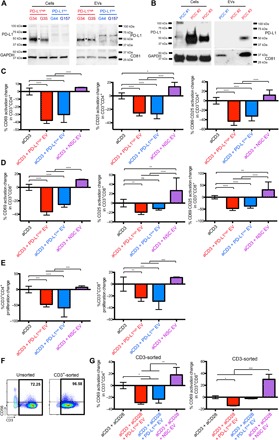
(A) Detection of PD-L1 by Western blot in glioblastoma EVs. Four GSCs were analyzed for their cellular and EV PD-L1 expression (red, PD-L1high; blue, PD-L1low). GAPDH, glyceraldehyde-3-phosphate dehydrogenase. (B) PD-L1 is found in primary cell cultures (PCCs) from glioblastoma patients and EVs isolated from these cell cultures. (C and D) PD-L1high and PD-L1low GSC EVs inhibit CD4+ (C) and CD8+ (D) T cell activation. Percent CD69 and CD25 and CD69+CD25+ expression change compared to anti-CD3 for 2 days ± glioblastoma EVs (5 μg/ml) from four different GSCs. Anti-CD3–stimulated PBMCs were from eight human volunteers ± PD-L1high/low EVs, and NSC EVs were added to anti-CD3–stimulated PBMCs from three human volunteers. (E) GSC EVs can inhibit T cell proliferation. Percent change of proliferating cells compared to anti-CD3 treatment after 3 days for CD4+ and CD8+ T cells, measured by CFSE content (aCD3 ± PD-L1high/low EVs, n = 7; NSC EVs, n = 3). (F) T cell inhibition is partially mediated by a direct effect on T cells. Left: unsorted PBMCs. Right: CD3+ cells are enriched after sorting. (G) CD3+CD4+ (left) and CD3+CD8+ (right) cells (n = 3) after treatment. Statistical analysis was performed by one-way analysis of variance (ANOVA), with post hoc Bonferroni’s correction (****P < 0.0001, ***P < 0.001, **P < 0.01, and *P < 0.05; ns, not significant.). Examples of the flow cytometry data are available at http://harveycushing.bwh.harvard.edu/chiocca-lab/.