
Fig. 5. PD-L1 expression correlates with M glioblastoma and IFN-γ response genes.
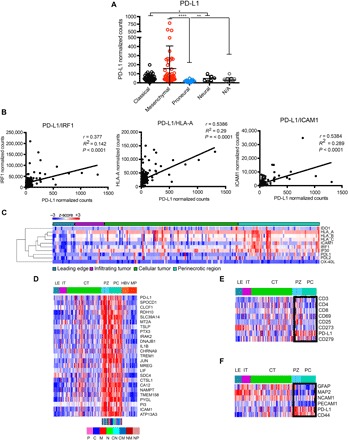
(A) Analysis of TCGA RNA-seq data for PD-L1 expression shows mesenchymal enrichment. The dots represent individual patients. (B) PD-L1 expression correlates with IFN-γ response factor (IRF1), human leukocyte antigen A (HLA-A), and intercellular adhesion molecule 1 (ICAM1) levels. (C) Ivy Glioma database RNA-seq analysis of laser-captured specimens from different regions of glioblastomas (leading edge, infiltrating tumor, cellular tumor, and perinecrotic areas) shows anatomical clustering of PD-L1 with known IFN-γ response genes. (D) The expression of PD-L1 correlates with immune response genes in perinecrotic and pseudopalisading niches of glioblastoma tumors. The correlation of PD-L1 expression (R > 0.6) with Ivy GAP database–based expression signatures in different anatomic areas of glioblastoma was analyzed (LE, leading edge; IT, infiltrating tumor; CT, cellular tumor; PZ, perinecrotic zone; PC, pseudopalisading cells around necrosis; HBV, hyperplastic blood vessels; MP, microvascular proliferation; P, proneural; C, classical; M, mesenchymal; N, neural). (E) The expression of PD-L1 inversely correlates with T cell markers in the tumor anatomic niche. Selected genes were queried with Ivy GAP database–based expression signatures in different anatomic areas of glioblastomas. The box denotes PZ and PC areas of tumor. (F) The expression of PD-L1 positively correlates with mesenchymal tumor markers in the tumor anatomic niche. Selected genes were queried with Ivy GAP database–based expression signatures in different anatomic areas of glioblastoma. The boxes denote PZ and PC areas of tumor. The Kruskal-Wallis test with Dunn’s correction was used to differentiate TCGA groups (****P < 0.0001, **P < 0.01, and *P < 0.05).