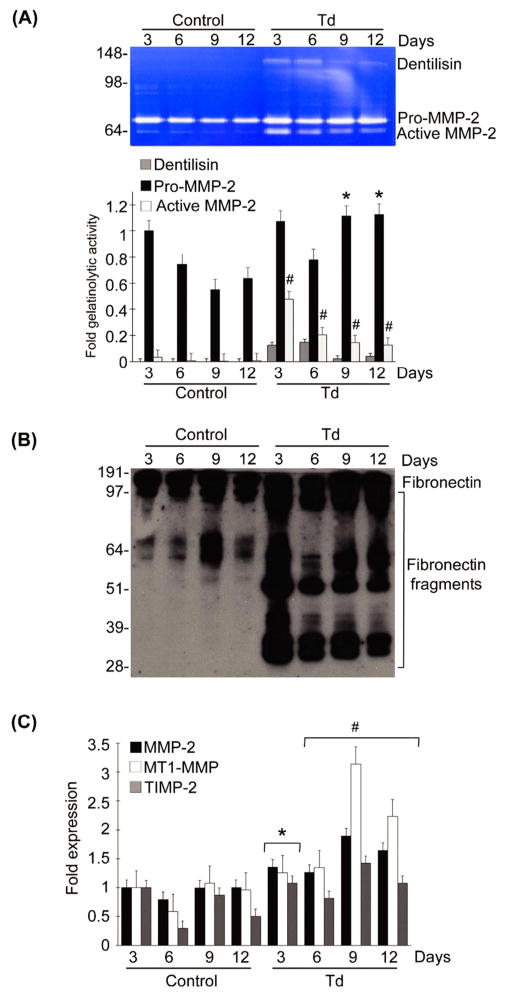
Figure 1. T. denticola mediates chronic expression and activation of MMP-2, MT1-MMP, and TIMP-2 in PDL cells, with subsequent fragmentation of cellular fibronectin.
Cultured PDL cells were challenged with T. denticola (Td) at MOI = 100 or media control for two hours, then incubated for 3, 6, 9, and 12 days with daily medium changes. The experiments were repeated three times in triplicate. Data were analyzed using one-way ANOVA. (*) represents p ≤ 0.05 compared to the same time point in the control group. (#) represents p ≤ 0.001 compared to the same time point in the control group.
Panel A: A representative gelatin zymogram of PDL cell conditioned medium showing the gelatinolytic activity of pro-MMP-2 (72-kDa), active MMP-2 (64-kDa), and Td dentilisin (100-kDa). The left 4 lanes represent the control unchallenged PDL cells and the right 4 lanes represent the Td-challenged PDL cells. The bar chart below represents the densitometric analysis of gelatinolytic activity in the zymograms using ImageJ™-NIH software. The Y-axis represents fold-gelatinolytic activity of the pro-MMP-2, active MMP-2, and dentilisin relative to unchallenged control at day 3. The X-axis represents different time points.
Panel B: A representative immunoblot of PDL cell culture supernatants probed with a polyclonal anti-fibronectin antibody showing FN fragmentation in conditioned medium from Td-challenged PDL cells.
Panel C: Transcript levels of MMP-2, MT1-MMP, and TIMP-2 in PDL cells at different time points after challenge with Td or media control assayed by qRT-PCR. The Y-axis represents fold-expression level of each gene relative to unchallenged control at day 3. The X-axis represents different time points.

