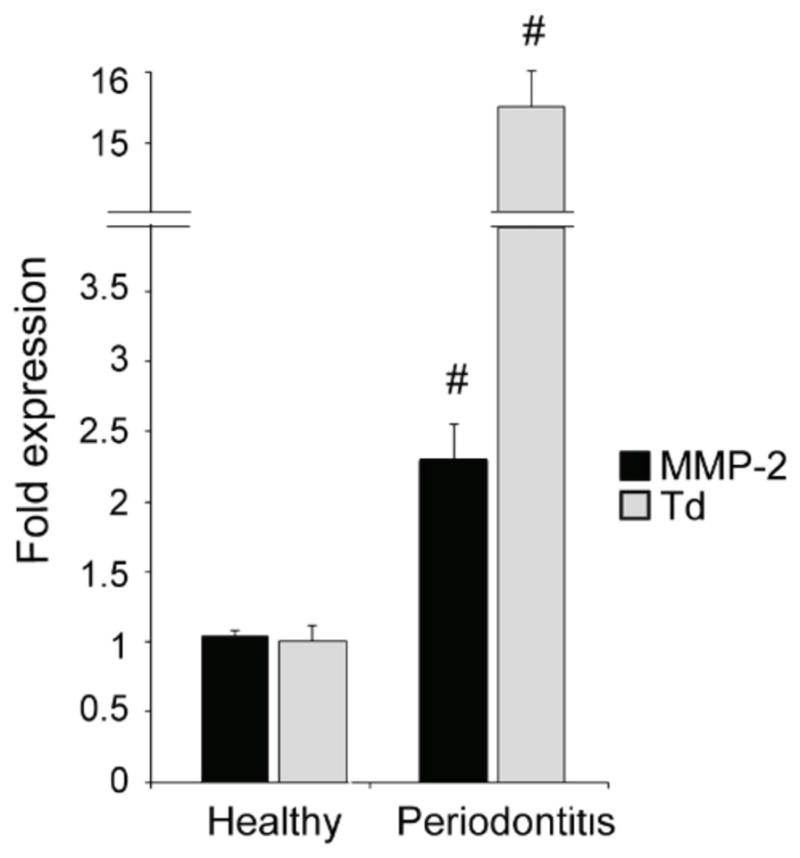
Figure 2. Elevated MMP-2 mRNA and T. denticola in diseased periodontal tissue.

Levels of T. denticola 16S rRNA and MMP-2 mRNA in tissue specimens from periodontally diseased or healthy sites were assayed by qRT-PCR. The Y-axis represents levels of each RNA in periodontitis specimens relative to healthy specimens. The X-axis represents the source of tissue specimens. Data were analyzed using Student’s t-test. (#) represents p ≤ 0.001 compared to healthy tissue.
