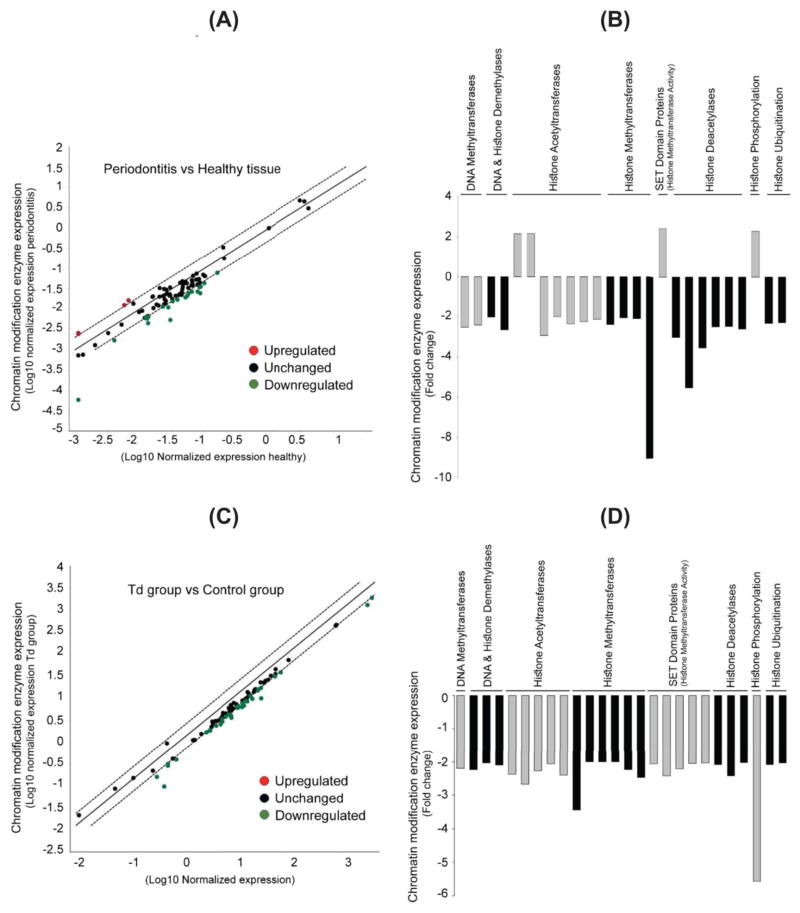
Figure 3. Transcription of multiple chromatin modification enzymes is altered in both periodontally diseased tissue and in T. denticola-challenged PDL cells.
Transcription levels of 87 chromatin modification enzymes were examined by qRT-PCR using RNA extracted from healthy and diseased periodontal tissues (Panels A and B, respectively) and from PDL cell lysates collected 9 days after Td challenge as described in Fig. 1 (Panels C and D, respectively).
Panels A and C: Scatter blots showing the transcriptional level of chromatin modification enzymes in periodontally diseased tissues relative to healthy tissue controls (Panel A) and in Td-challenged PDL cells relative to unchallenged control cells (Panel C). The Y-axis represents expression level of different enzymes relative to healthy tissue (Panel A) or unchallenged control cells (Panel C). The X-axis represents normalized expression of the respective control group.
Panels B and D: Bar-charts showing the significantly downregulated chromatin modification enzymes in periodontally diseased tissues relative to healthy tissue controls (Panel B) and in Td-challenged PDL cells relative to unchallenged control cells (Panel D). The Y-axis represents the fold-expression/downregulation level of enzymes relative to unchallenged controls. The X-axis represents different chromatin modification enzymes, with enzyme type grouped by color.

