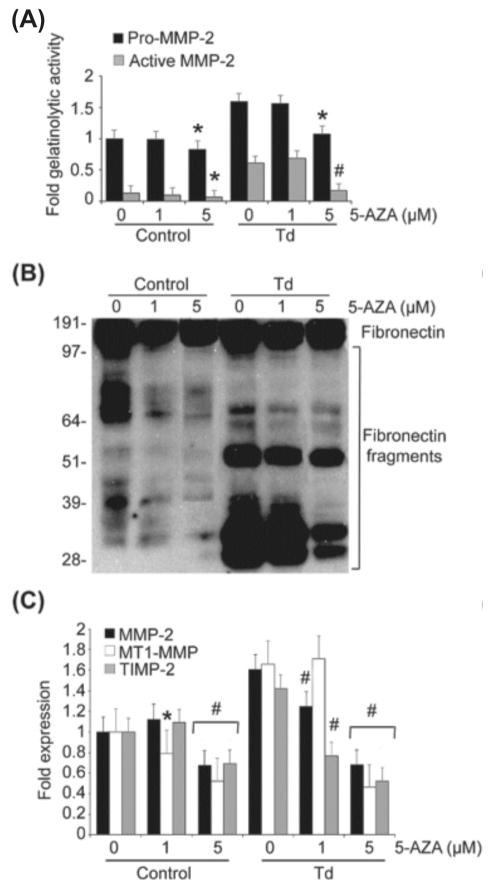
Figure 5. Inhibition of DNA methyltransferases using AZAcytidine (AZA) result in decreased expression and activation of MMP-2, MT1-MMP and TIMP-2, and decreased fibronectin fragmentation in T. denticola-challenged and control PDL cells.
Cultured PDL cells were pre-treated with 1 or 5 μM AZA for four days. The cells were then challenged with T. denticola (Td) at MOI = 100 or media control for two hours then incubated for three days. The conditioned medium and cell lysates were collected for zymography, western blotting, and qRT-PCR. The experiments were repeated three times in triplicate.
Panel A: Densitometric analysis of pro-MMP-2 (72kDa) and active MMP-2 (64kDa) detected by gelatin zymography. The X-axis represents different concentrations of DNA methyltransferases inhibitor Azacytidine (AZA) in the control and Td groups. The Y-axis represents fold-gelatinolytic activity of the pro-MMP-2 and active MMP-2 relative to unchallenged and untreated controls. Data were analyzed using one-way ANOVA. (*) represents p ≤ 0.05 compared to the “0” concentration in the same group. (#) represents p ≤ 0.001 compared to the “0” concentration in the same group.
Panel B: A representative immunoblot of PDL cell culture supernatants probed a polyclonal anti-fibronectin antibody showing FN fragmentation in conditioned medium from Td-challenged PDL cells, control and AZA-treated.
Panel C: Bar chart showing transcript levels of MMP-2, MT1-MMP and TIMP-2 in the control and AZA-treated PDL cells as determined by qRT-PCR. The Y-axis represents fold-expression level of each gene relative to unchallenged and untreated controls. The X-axis represents different concentrations of AZA in the control and Td groups.

