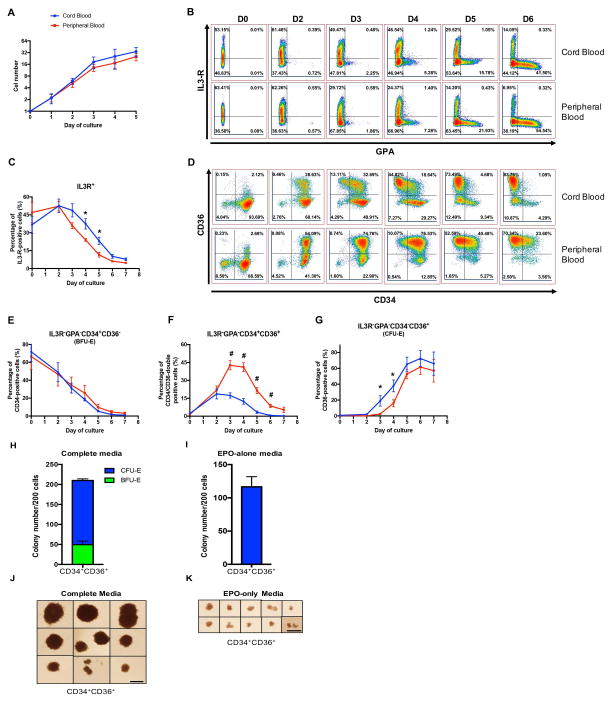
Figure 2. CB-HSPCs exhibit a significantly higher CFU-E differentiation potential than PB-HSPCs.
(A) Growth curves of sorted proerythroblasts derived from CB (blue) and PB (red) CD34+ cells at the indicated time points (N=4). (B) Representative dot plots of GPA versus IL-3R expression at the indicated time points of erythroid differentiation. (C) Quantification of IL-3R expression at the indicated days of differentiation (N=6). (D) Representative dot plots of CD36 versus CD34 expression within the gated IL-3R−/GPA− population. BFU-E and CFU-E are identified as IL-3R−GPA−CD34+CD36− and IL-3R−GPA−CD34−CD36+, respectively. (E–G) Quantification of the percentages of IL-3R−GPA−CD34+CD36− (E), IL-3R−GPA−CD34+CD36+ (F), and IL-3R−GPA−CD34−CD36+ (G) cells at the indicated days of in vitro erythroid differentiation (N=6). (H–K) The erythroid colony forming ability of sorted IL-3R−GPA−CD34+CD36+ cells derived from PB was assessed in a colony-forming assay in complete medium supporting multiple lineage colony formation (H) and in the presence of EPO-alone (I), (N=3) and representative images of erythroid colonies generated from PB-derived IL-3R−GPA−CD34+CD36+ cells in complete media (J) or EPO-alone (K). Scale bar=1mm. *P<0.05, **P<0.01.

