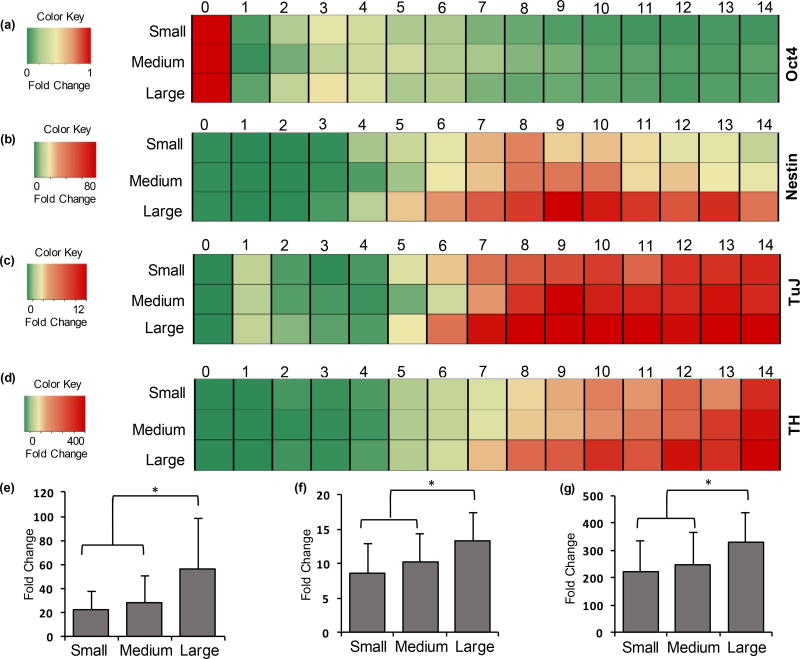
Figure 7.
Expression of neural genes varies with colony size. Heatmaps representing temporal mRNA fold change over 14 days of culture for (a) Oct4, (b) Nestin, (c) TuJ, and (d) TH in mESC colonies of three different sizes. One-way ANOVA on mRNA expressions of (e) Nestin (days 6–14), (f) TuJ (days 7–14), and (g) TH (days 7–14) show significantly higher expressions in large colonies compared to the medium and small colonies. * p<0.01. (e) n= 27, (f,g) n= 24. Error bars represent mean±S.D.

