Fig. 1.
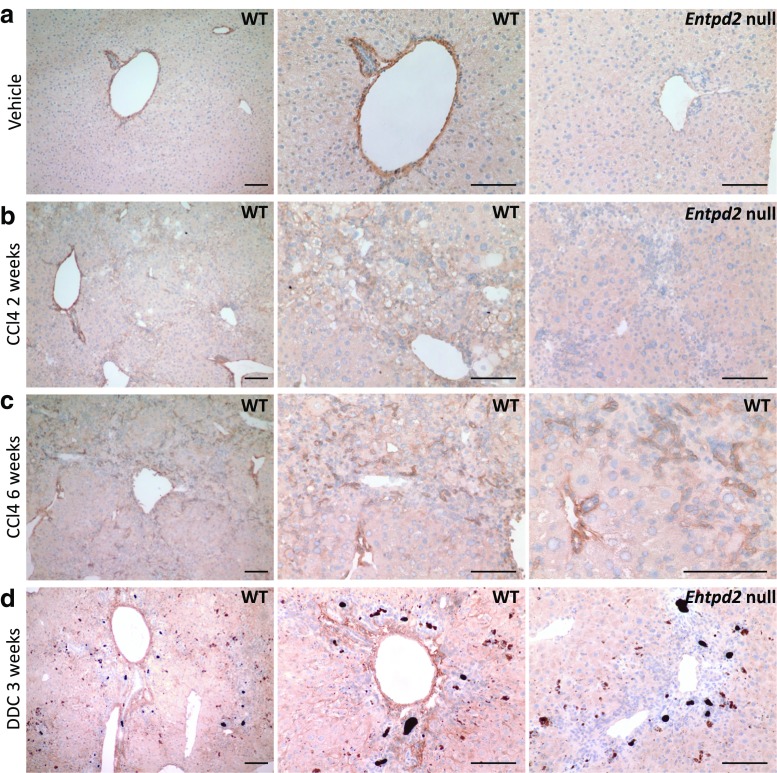
NTPDase2 expression in normal liver and liver fibrosis. a NTPDase2 in control liver. b NTPDase2 after 2 weeks of CCl4 treatment. c NTPDase2 after 6 weeks of CCl4 treatment. d NTPDase2 after 3 weeks of DDC feeding. Scale bars show 100 μm. Entpd2 null samples are shown in a, b, and d as controls for antibody specificity

