
Fig. 8.
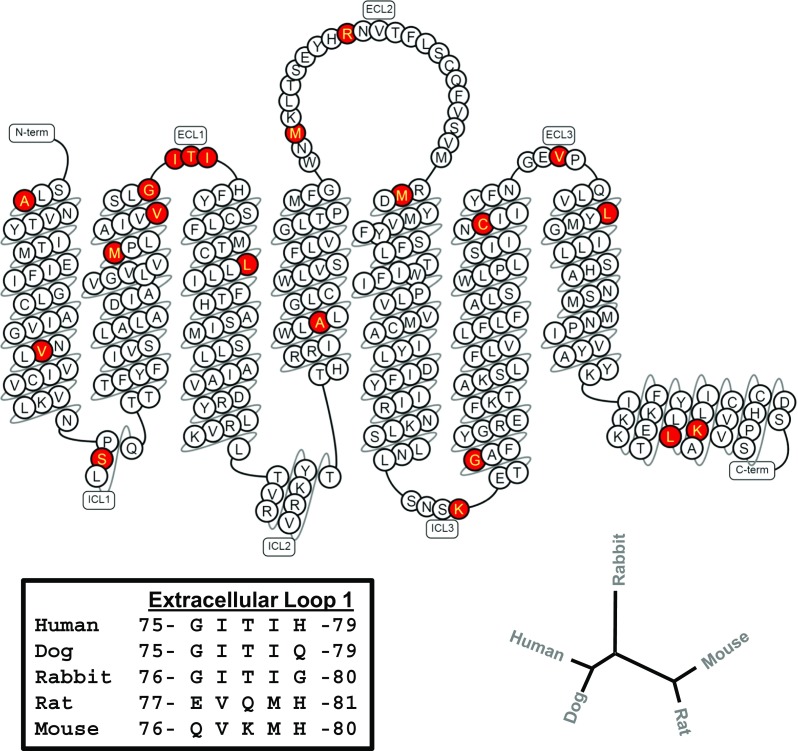
“Snake” diagram of the human A3AR sequence. Amino acid residues that are conserved in species found to be responsive to both modulator compounds (human, dog, rabbit) but are not conserved in weakly responding species (rat, mouse) are highlighted in red. According to this criterion for comparison, marked variability was identified in the first extracellular loop region. Detailed amino acid sequence comparison of this region is shown in the lower left-hand section of the illustration. The dendrogram in the lower right-hand corner reveals that A3AR sequences from responsive and less responsive species cluster together. This diagram was prepared using the GPCRdb database (http://www.gpcrdb.org).