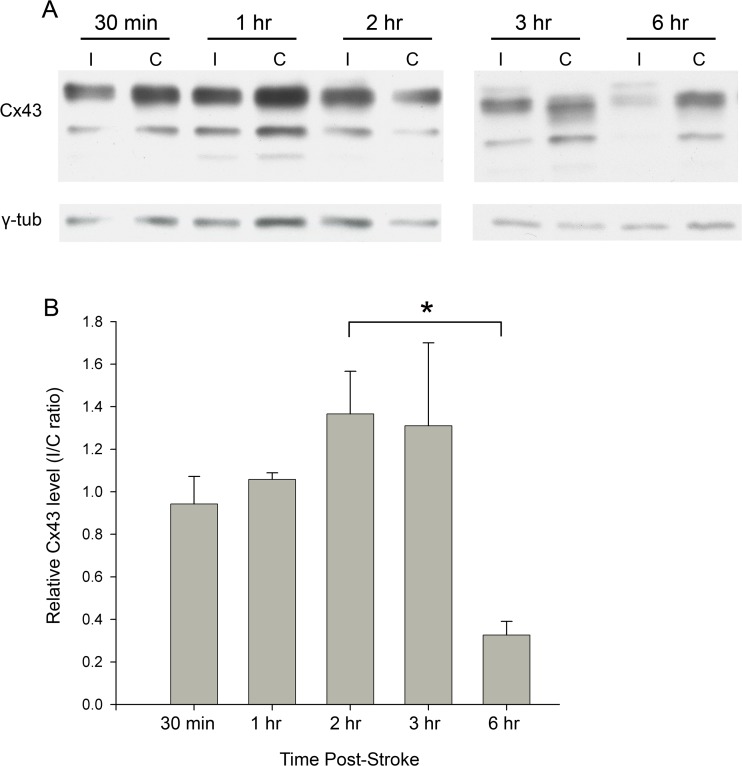
Fig. 2.
Western blot analysis shows pattern of Cx43 expression in cerebral tissue acutely following stroke. Mice underwent pMCAO and were perfused after 30 min, 1 h, 2 h, 3 h, and 6 h. The area impacted by pMCAO on the ischemic side (“I”), as well as the mirrored area on the contralateral side (“C”), was removed and permeabilized; these samples were run on blots shown in (A). Intensity of Cx43 bands was measured and normalized against γ-tubulin; these values are plotted as a ratio of I/C on the y-axis in (B). Sample size: n = 4. Statistical analysis was performed using Kruskal-Wallis One Way Analysis of Variance on Ranks

