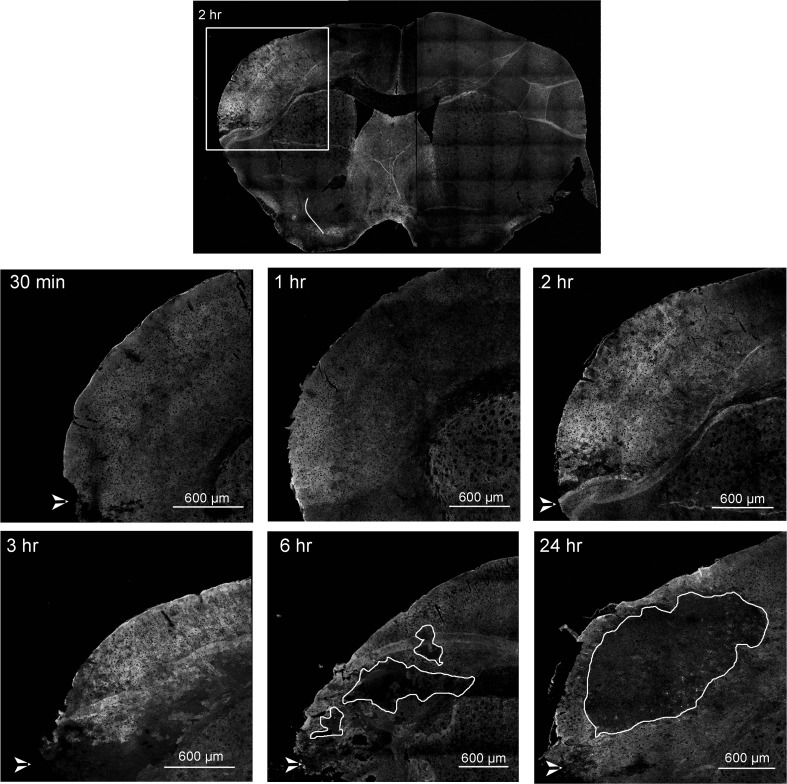
Fig. 3.
Overview timeline of stroke regions. Fluorescent immunohistochemical staining of Cx43 on mouse coronal brain sections. The box area in the upper image shows the region of the brain typically affected by right hemisphere pMCAO; subsequent images are enlarged in the lower figures. Increased Cx43 immunoreactivity is evident starting at 1 h, peaking between 2 h to 3 h, and exhibiting an area of no staining in the infarct core starting at 6 h which continued to grow at 24 h, with intense Cx43 staining in the peri-infarct zone. White arrowheads in the bottom left of these images indicate the cauterization point. White line delineates the infarct core at 6 and 24 hrs

