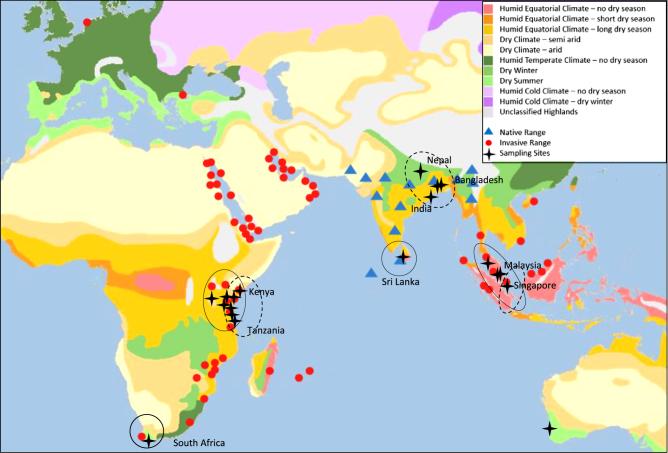
Fig. 1.
Distribution of the House Crow within native and invasive range (blue triangles and red circles, respectively) and distribution of the collected samples (black crosses) mapped over a Köppen–Geiger climate classification map (Kottek et al. 2006). Species distribution sourced from the Invasive Species Compendium (http://www.cabi.org/isc/datasheet/15463). Circles over sampling sites indicate which clade on a phylogenetic tree (Fig. 2) the samples belong to, dashed line indicates native north clade while solid line indicates native south clade

