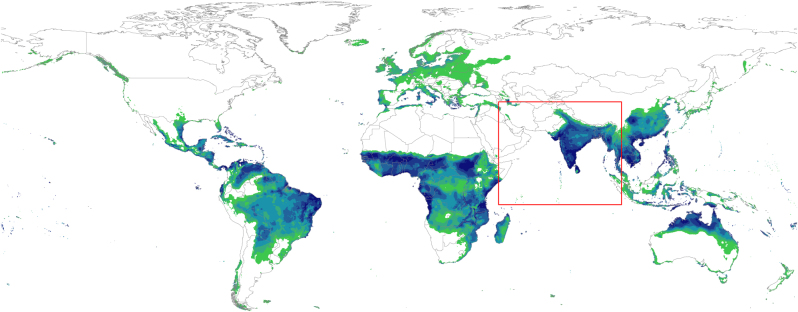
Fig. 4.
Map representing suitable areas of House Crow invasion based on the MaxEnt model generated from bioclimatic variables of the species’ native range (red square) and projected onto a global scale. Hues of green represent lower suitability, while dark blue indicates highly suitable conditions. The model represents a thresholded output, allowing for a 10% omission error of occurrence points used in model training

