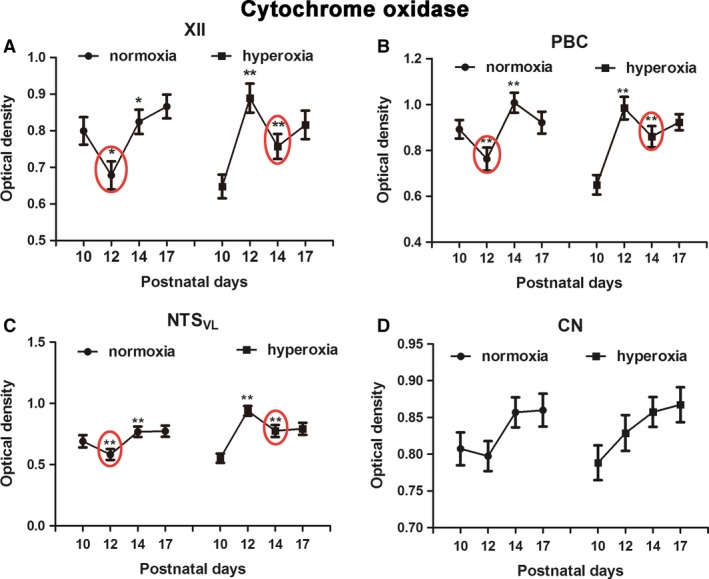
Figure 1.

Optical densitometric values of cytochrome oxidase at the 4 developmental time points were plotted separately for the normoxic and the hyperoxic groups. A significant fall in CO reactivity at P12 and a significant rise at P14 were found in XII (A), PBC (B), and NTSVL (C), but not in CN (D) of normoxic animals (left graph of each panel). In hyperoxic animals, however, the pattern was shifted to the right, such that the P10‐12‐14 pattern of normoxia became that of P12‐14‐17 of hyperoxia with a distinct fall at P14 in the latter group (right graph of each panel). N = 5 for each group for this and all subsequent figures. *P < 0.05; **P < 0.01 (Tukey's test comparing one age group with its immediately younger age group).
