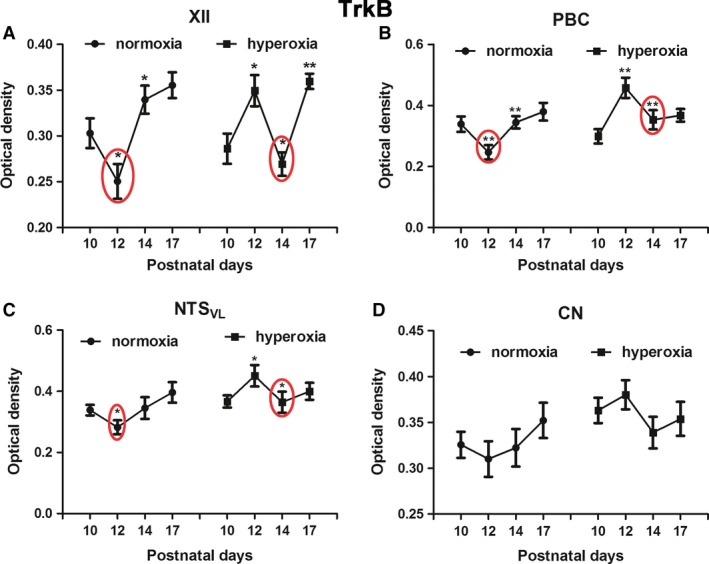
Figure 3.

Optical densitometric measurements of immunoreaction product of TrkB in neurons of XII (A), PBC (B), NTSVL (C), and CN (D) of normoxic and hyperoxic animals at P10, P12, P14, and P17. In the first three nuclei, the P10‐12‐14 pattern of normoxic animals with a distinct fall at P12 is comparable to that of P12‐14‐17 in hyperoxic animals, in which the significant fall is at P14. No significant differences were found between the age groups in either normoxic or hyperoxic animals in the CN. N = 5 for each group. *P < 0.05; **P < 0.01 (Tukey's test).
