
Figure 4.
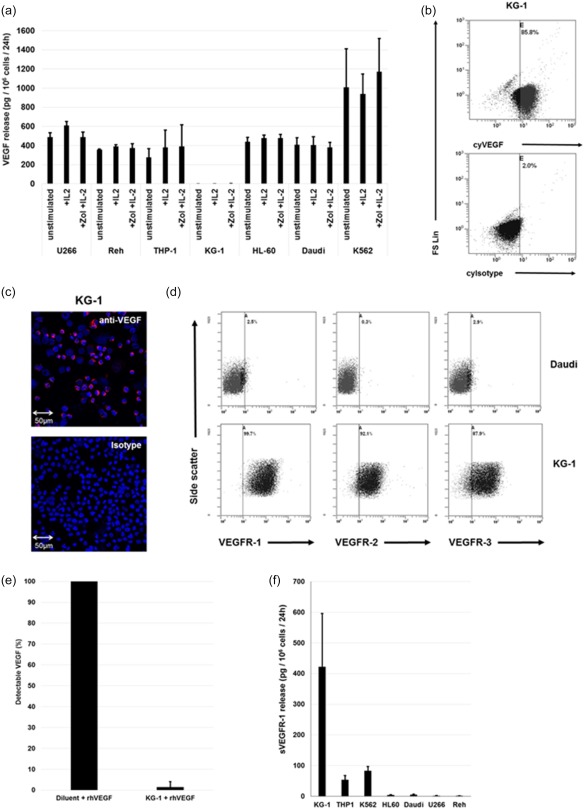
Vascular endothelial growth factor (VEGF) production and VEGF receptor (VEGFR) expression by leukaemia and lymphoma cell lines. (a) VEGF release/106 unstimulated leukaemia or lymphoma cells/24 h and effect of interleukin (IL)‐2 and zoledronic acid (Zol) + IL‐2 treatment. Shown are the results from three different treatment regimens: (1) unstimulated, (2). IL‐2 (100 U/ml IL‐2), (3) Zol + IL‐2 (1 µM Zol and IL‐2 100 U/ml). Concentrations of VEGF were measured in the supernatants using enzyme‐linked immunosorbent assay (ELISA) and normalized with regard to cell count and culture time. Differences in VEGF production comparing treatments were not statistically significant (b) Measurement of VEGF content in the KG‐1 cell line by flow cytometry. Cytoplasmic Isotype (cyIsotype), cytoplasmic VEGF (cyVEGF), forward‐scatter linear (FS Lin). (c) Immunofluorescence analysis of the VEGF content in KG‐1 cell line with anti‐VEGF or isotype primary antibody and cyanin 3 (Cy3)‐coupled secondary antibody. (d) Flow cytometry analysis of VEGFR‐1, −2 and −3 expression of two of seven cell lines: Daudi and KG‐1. (e) Soluble factors interfere with detection of VEGF. Detectable free VEGF by ELISA after spiking of 400 pg/ml recombinant human VEGF (rhVEGF) into supernatants of KG‐1 compared to spiking the same amount into calibrator diluent. (f) Soluble VEGF (sVEGFR)‐1 release/106 leukaemia or lymphoma cells/24 h. Concentrations of sVEGFR‐1 were measured in the supernatants by ELISA and normalized with regard to cell count. All data are either presented as a representative example of at least three independent experiments or depicted as mean ± standard deviation (s.d.) from at least three independent experiments. [Colour figure can be viewed at wileyonlinelibrary.com]