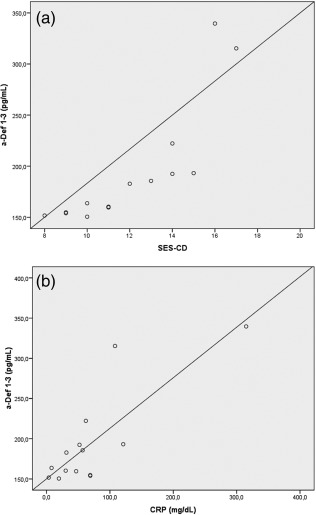
Figure 3.

(a) Scatter‐plot of α‐defensins 1–3 (α‐Defs) concentrations in plasma of patients with active Crohn's disease (CD) against endoscopic score (Spearman's rank correlation = 0·934; P < 0·01). (b) Scatter‐plot of α‐Defs 1–3 concentrations in plasma of patients with active CD against serum C‐reactive protein (CRP) levels (Spearman's rank correlation = 0·696; P < 0·01).
