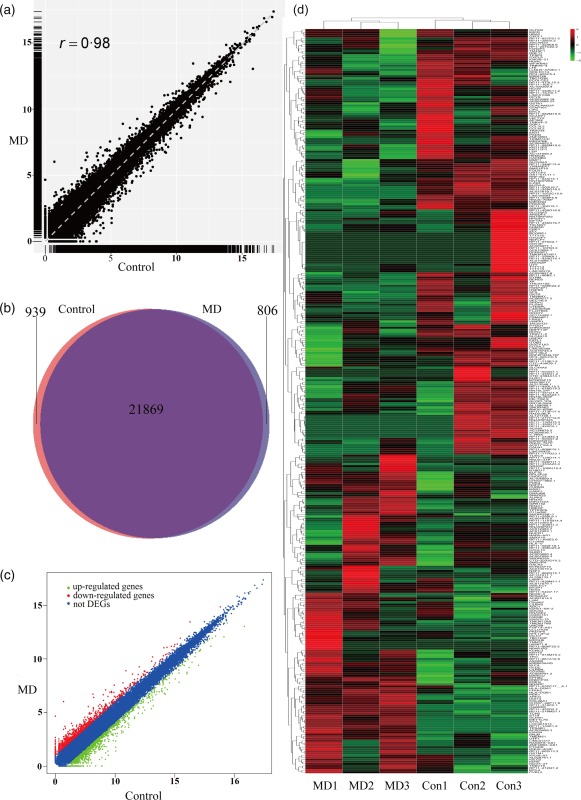
Figure 1.

Analysis of homogeneity between peripheral blood monocular cells of volunteers and Ménière's disease (MD) patients. (a) Expression analysis of volunteer and MD samples. The Pearson correlation coefficient is shown. (b) Venn diagram showing 939 and 806 genes expressed in volunteer and MD group. (c) Scatterplot of differentially expressed genes and sample clustering analysis for all replicates of volunteer and MD samples. Results show the expression levels of 154 genes are observed up‐regulated and 212 genes are observed down‐regulated (P < 0·05 and |log2 fold change| >1). (d) Heat map is generated from normalized fragments per kilobase (FPKM) of 366 consistent differentially expressed genes (DEGs) among three paired samples. The expression level of each transcript is represented by a colour range from green (low) to red (high). [Colour figure can be viewed at wileyonlinelibrary.com]
