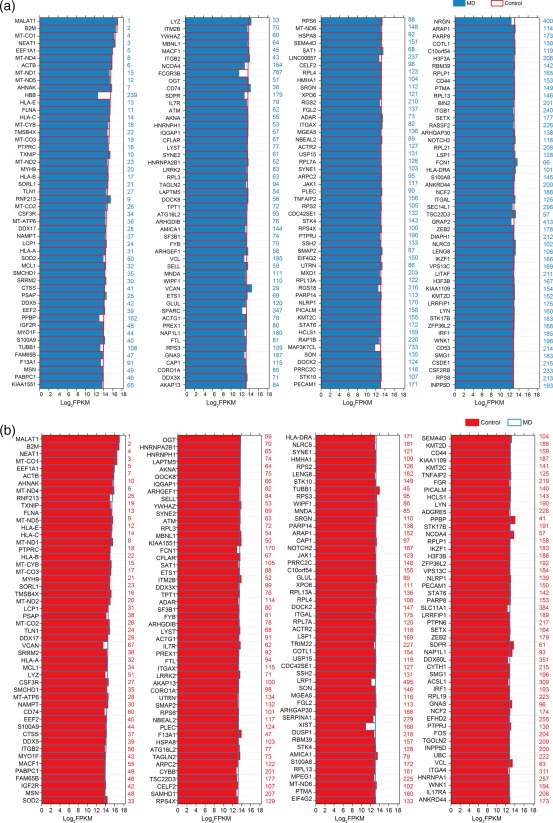
Figure 2.

Expression levels of the top 200 genes in volunteer and Ménière's disease (MD) samples. (a) Expression levels of the top 200 genes in the volunteer group in descending order. Numbers in blue on the right side of each panel represents the ranking of the same genes in MD group. (b) Expression levels of the top 200 genes in the MD group in descending order. Numbers in red on the right side of each panel represents the ranking of the same genes in volunteer group. [Colour figure can be viewed at wileyonlinelibrary.com]
