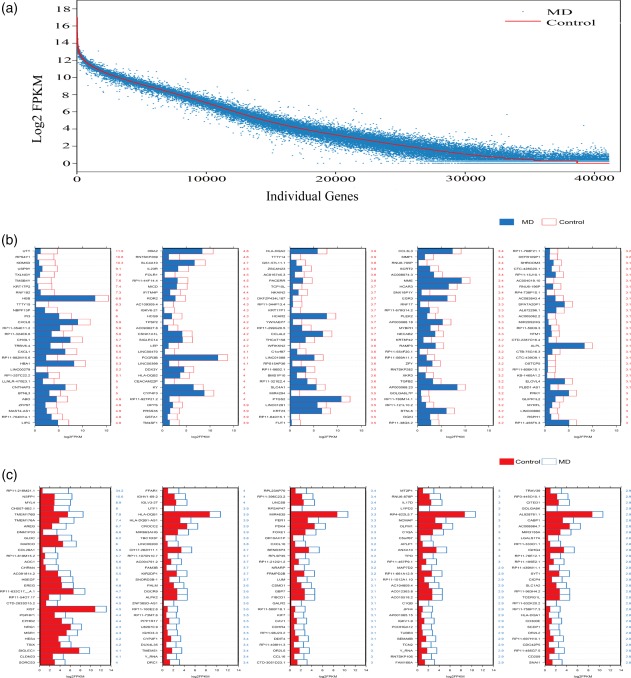
Figure 3.

Differentially expressed genes (DEGs) in control and Ménière's disease (MD) groups. (a) All DEGs in control and MD samples. The red line indicates the expression level of 36 333 transcripts in the control group, and each blue dot represents the expression level of the same transcripts in the MD group. (b) The 150 most DEGs in the control group. The numerical values in red on the right side of each panel represent the fold difference in expression for control versus MD. (c) The 150 most DEGs in the MD group. The numerical values in blue on the right side of each panel represent the fold difference in expression for MD versus control. [Colour figure can be viewed at wileyonlinelibrary.com]
