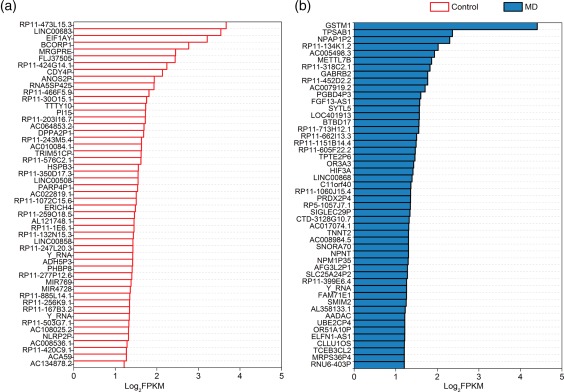
Figure 4.

The top 50 uniquely expressed genes in control and Ménière's disease (MD) groups. (a) The top 50 uniquely expressed genes in control group in descending order. (b) The top 50 uniquely expressed genes in MD group in descent order. Glutathione S‐transferase mu 1 (GSTM1) exhibits highest fold change between MD patients and controls. [Colour figure can be viewed at wileyonlinelibrary.com]
