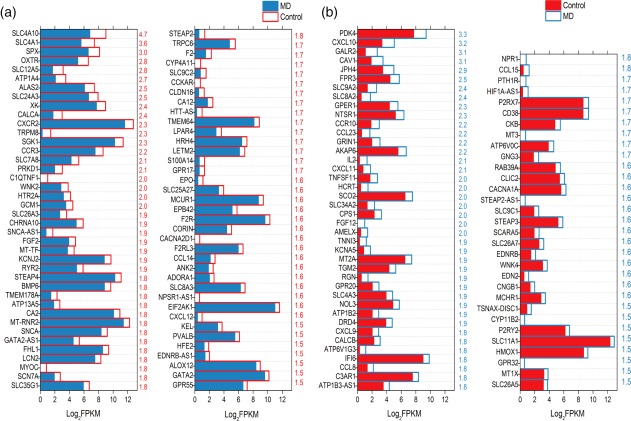
Figure 5.

Genes related to ion homeostasis. (a) Comparison of expression levels for genes that encode proteins associated with ion homeostasis by dividing the value of control with that of Ménière's disease (MD). Numerical values in red in the right side of each panel represent the ratio of control versus MD. (b) Comparison of expression levels for genes that encode proteins associated with ion homeostasis by dividing the value of MD with that of control. Numerical values in blue in the right side of each panel represent the ratio of MD versus control. [Colour figure can be viewed at wileyonlinelibrary.com]
