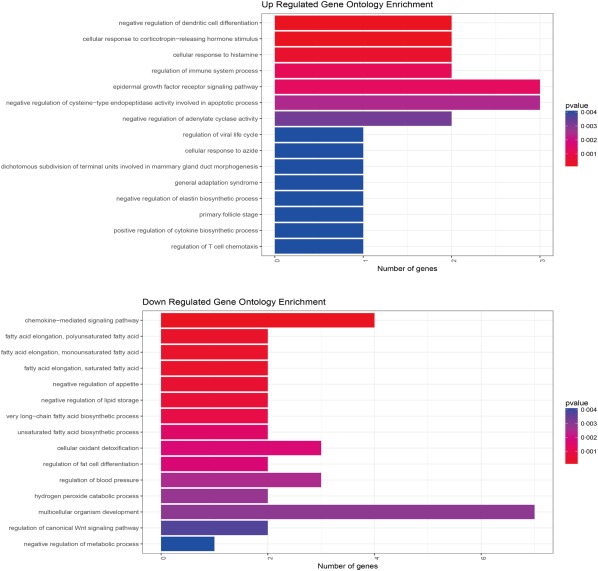
Figure 6.

Top gene ontology (GO) analysis of differentially expressed genes (DEGs) in Ménière's disease (MD) patients. The top enriched GO terms of the up‐regulated and down‐regulated DEGs in biological progress are shown. The adjusted enrichment P‐ values are labelled in different colours in the graph. [Colour figure can be viewed at wileyonlinelibrary.com]
