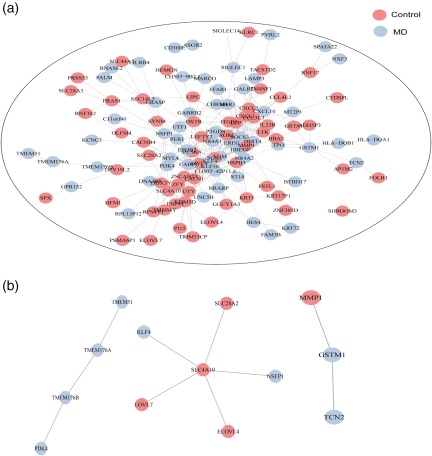
Figure 7.

Protein–protein interaction network analysis of the differentially expressed genes (DEGs) in control and Ménière's disease (MD) groups. (a) PPI network for DEGs in both groups supplying a complicated interaction network. (b) Specific protein–protein interaction (PPI) network for protein products of glutathione S‐transferase mu 1 (GSTM1), solute carrier family 4 member (SLC4)A10, transmembrane protein 176 (TMEM176)A and TMEM176B. [Colour figure can be viewed at wileyonlinelibrary.com]
