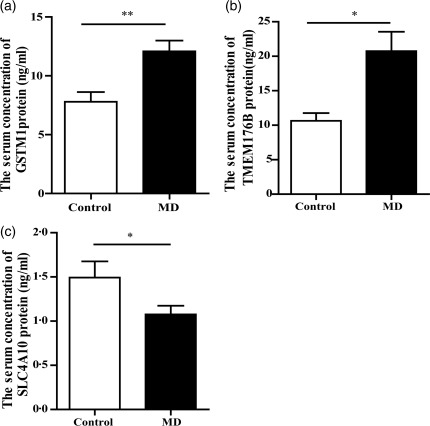
Figure 9.

Validation of protein products by enzyme‐linked immunosorbent assay (ELISA) in another 30 paired samples. (a‐c) The serum levels of glutathione S‐transferase mu 1 (GSTM1), transmembrane protein 176 (TMEM176)B and solute carrier family 4 member (SLC4A)10 protein products are shown for each group studied. Asterisk indicates a significant difference when compared with controls. *P < 0·05; ** P < 0·01·
