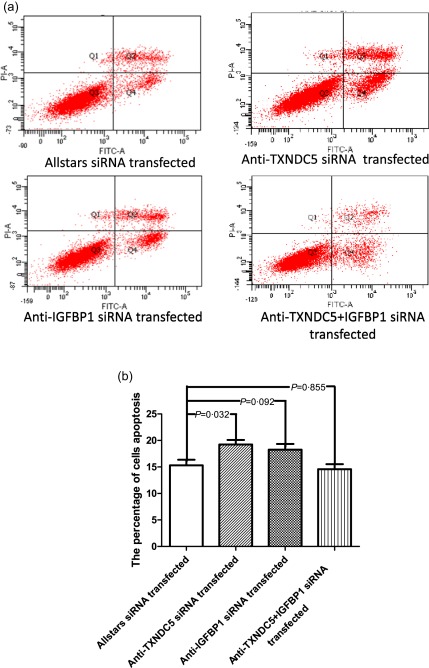
Figure 7.

Measurement of rheumatoid arthritis synovial fibroblast‐like cell (RASF) apoptosis using flow cytometry. (a) RASFs (n = 10) transfected with the siRNA. (b) The results of the RASF apoptosis assay are presented in a bar graph. The figure shows the standard deviation (s.d.) to indicate the variability of the data.
