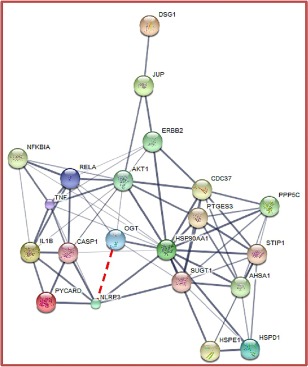
Figure 4.

Data analysis by Search Tool for Interacting Chemicals (STITCH) version 5.0 for prediction of relationships among: O‐GlcNAcylation (OGT: O‐GlcNAc transferase); nuclear factor kappa B (NF‐Κb) signaLling (RELA: transcription factor p65; TNF: tumour necrotic factor); danger‐associated molecular patterns [hear shock protein (HSP)D1: HSP60; HSP90AA1: HSP90]; nucleotide‐binding domain‐like receptor family pyrin domain containing 3 (NLRP3) inflammasome [NLRP3, cASP1: caspase‐1, interleukin (IL)‐1β)]; epithelial cell differentiation and cell adhesion (DSG1: desmoglein1; JUP: junction plakoglobin) (http://stitch.embl.de/cgi/network.pl?taskId=1t51EemYpTt0). The red dashed line was established to demonstrate the correlation between OGT and NLRP3 according to the immunohistochemical analyses. [Colour figure can be viewed at wileyonlinelibrary.com]
