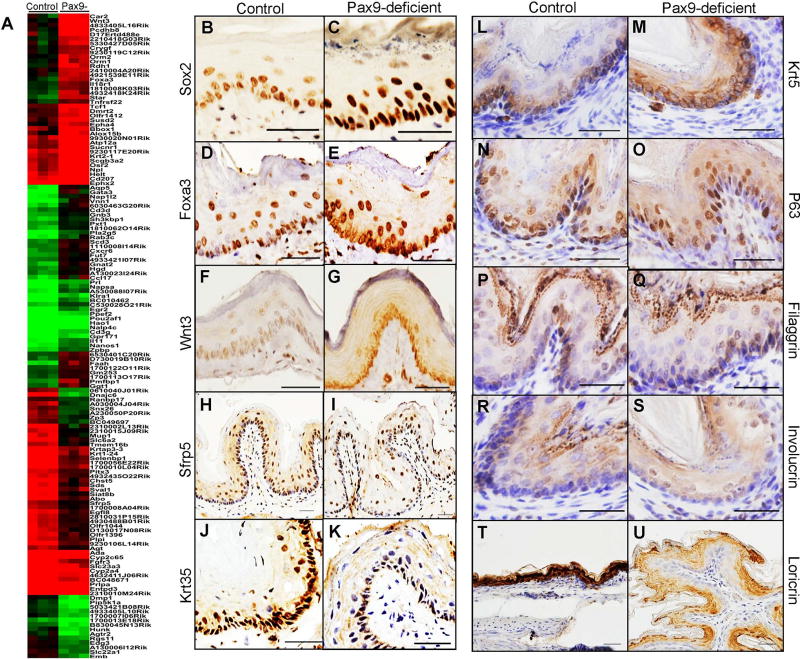
Figure 2. Differentially expressed genes in Krt5Cre;Pax9loxP/loxP esophagus.
Control and mutant esophagus were clustered based on differential expression of genes identified by SAM (A). IHC showed expression of SOX2 (B, C: Scale bar=50 µm), FOXA3 (D, E: Scale bar=50 µm), WNT3 (F, G: Scale bar=50 µm), SFRP5 (H, I: Scale bar=100 µm), KRT35 (J, K: Scale bar=50 µm), KRT5 (L, M: Scale bar=50 µm), P63 (N, O: Scale bar=50 µm), filaggrin (P, Q: Scale bar=50 µm), involucrin (R, S: Scale bar=50 µm) and loricrin (T, U: Scale bar=50 µm) in the mutant esophagus as compared with the wild-type esophagus. Bar represents mean ± SD.

