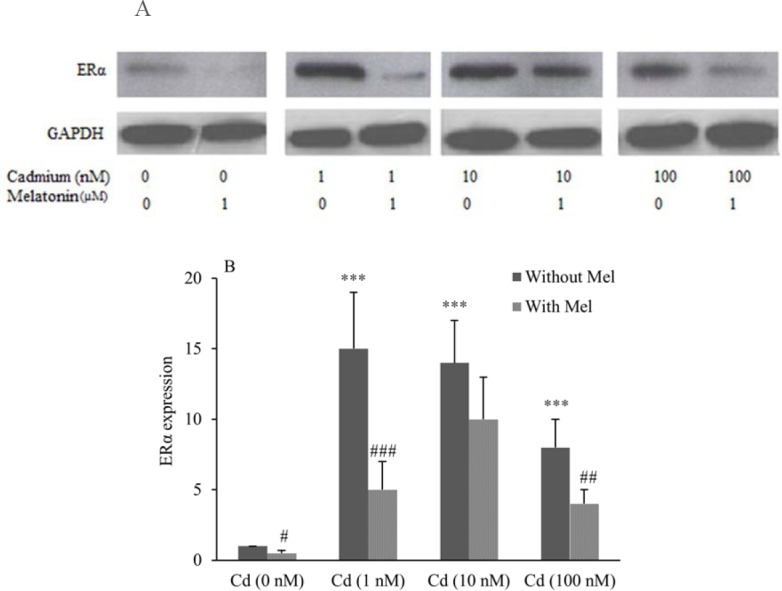
Fig. 3.

Modulation of estrogen receptor α (ERα) expression in OVCAR3 cells treated with CdCl2 and assessment of inhibitory effect of melatonin. (A), evaluation of ERα expression performed using Western blotting technique. (B), Quantitative analysis of relative level of ERα expression performed by image j software. *** shows significant differences vs. Cd (0 nM) without melatonin (P < 0.001). #, ##, and ### show significant differences between the cells treated with melatonin and corresponding cells without melatonin (P < 0.05, P < 0.01 and P < 0.001, respectively). (Mel), melatonin; (Cd), CdCl2.
