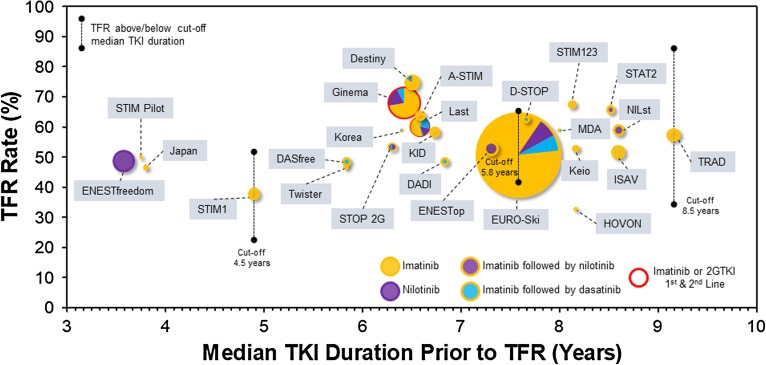
Fig. 1.
Bubble plot showing the rate of treatment-free remission TFR (%) versus the median TKI duration (years) prior to TKI cessation for different studies listed in Table 1. The size of the circles is proportional to the number of patients in the various studies, and TKI exposure is shown in the color legend. The rate of TFR observed in patients above or below a “cutoff” median duration of TKI therapy is shown for the STIM1, EURO-Ski, and TRAD studies.

