Fig. 4.
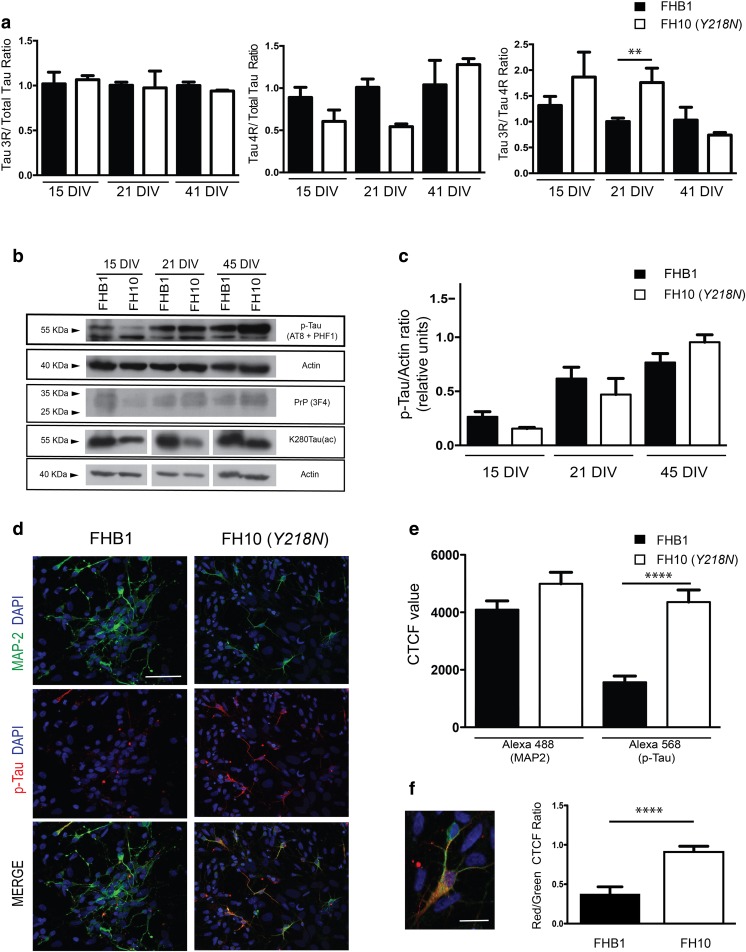
Delayed MAPT maturation and increased p-Tau in Y218N -derived neurons. (a) Histograms illustrating RT-qPCR results (mean ± S.E.M.) of Tau 3R/Total tau; Tau 4R/Total and Tau 3R/4R ratios in FHB1 and FH10 (Y218N) iPS cell cultures during differentiation at 15, 21 and 41 days in vitro. Asterisks in the right graph indicate P < 0.05, Bonferroni post hoc test; Mean Diff. -0.756; 95% confidence interval = −1.372 to - 0.1415). (b) Time course of p-Tau, PrPC and K280Tau-(ac) expression in FHB1 and FH10 (Y218N) at 15, 21 and 45 DIV. Actin was used as control loading protein. (c) Graph of the densitometric values of p-Tau levels of (b). Plots show mean ± S.E.M. of three different experiments. Note the increase in p-Tau between Y218N and control cells. (d) High power photomicrographs illustrating MAP2 (green), p-Tau (red) in FHB1 and FH10 (Y218N) neural cultures. A high magnification of a labelled cell is showed in (f). (e-f) Quantification of CTCF values derived from experiments in (d). Plots show mean ± S.E.M. of four different experiments. Asterisks in (e) indicate statistical differences between groups and controls. **** P < 0.001; Mann-Whitney U test. Scale bars in d = 50 μm and f = 10 μm

