Fig. 5.
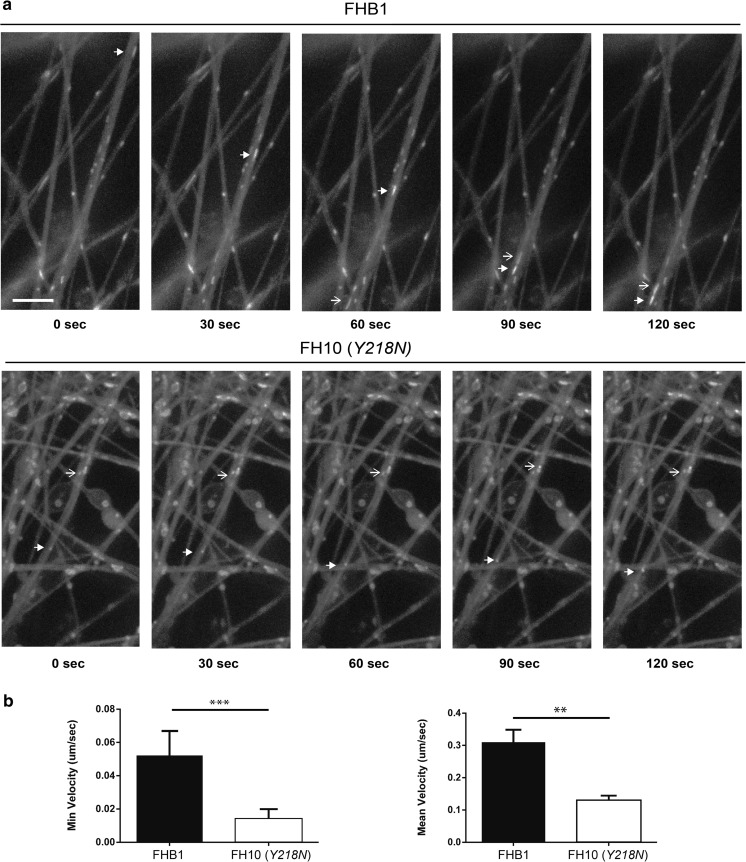
FH10 (Y218N) cultures showed impaired mitochondria displacement. (a) Time-lapse fluorescence photomicrographs illustrating mitochondria movement in FHB1- (upper panels) and FH10 (Y218N)- (lower panels) derived neurons. The movement of two mitochondria (arrow and open arrow in (a) can be seen in the time lapse panels. (b) Plots illustrating the Minimum and Mean velocity values of tracked mitochondria in both types of cultures (see Methods for details). Notice the strong decreases in velocity in FH10 (Y218N)-derived cultures. Plots show mean ± S.E.M. of three different differentiation experiments. ***P < 0.01, ** P < 0.05. Mann Whitney U test. Scale bar: a = 2.5 μm

