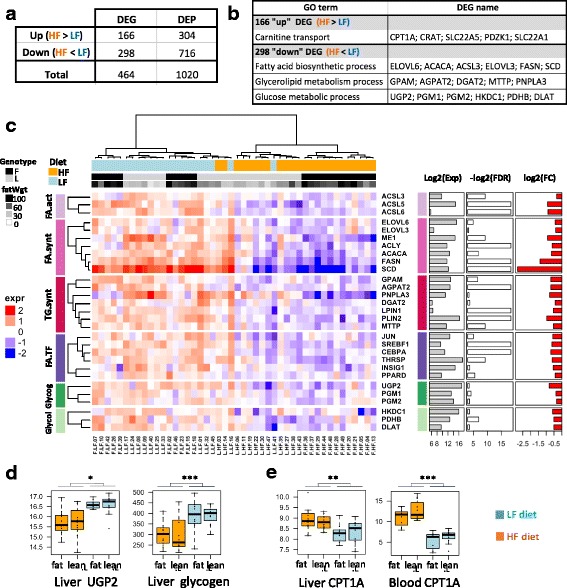
Fig. 3.

Hepatic expression of key genes involved in fatty acid and glucose metabolism. a List of genes up- and down-regulated in HF diet vs. LF diet. DEP: DE probes; DEG: DE genes. b GO term enrichment for these two up- and down-regulated gene lists. c Heatmap based on gene expression and depicting the main genes related to fatty acid and glucose metabolism. Glycog: glycogen synthesis, Glycol: glycolysis, FA.act: FA activation, FA.synt: FA synthesis, TG.synt: TG synthesis, FA.TF: transcription factor related to FA metabolism. Column annotations: F = fat line L = lean Line, fatWgt = fat weight (g). Row annotations: Exp = mean expression, FDR = corrected p-value (False Discovery Rate), FC = fold change between HF and LF diet (ratio HF/LF). d Hepatic UGP2 expression and Glycogen (μmol/g of tissue). E. Hepatic and blood CPT1A expression
