Fig. 2.

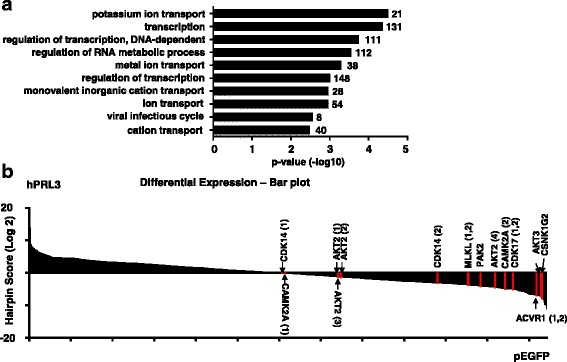
Functional diversity of PRL-3 synthetic lethal genes. a Bar chart showing the enriched functional classification of candidate genes (y-axis) in Additional file 1: Table S1 based on biological processes as annotated in Gene Ontology Consortium (www.geneontology.org) and the corresponding p value in –log10 scale (x-axis). The p value denotes selective enrichment for genes in the corresponding biological process. The number of genes was given next to the bar. b Pooled negative-selection screening in hPRL3 overexpressing leukemia cell line, depicting changes in representation of informative shRNAs (x-axis) during 12 days of culture. The hairpins are aligned from the highest to lowest hairpin score (y-axis). Highlighted shRNAs in bar plot are protein kinases which are critical for the survival of PRL-3 overexpressing leukemia cells. The highlighted shRNAs are based on RIGER analysis results and not all shRNAs targeting a gene are reported
