Fig. 3.

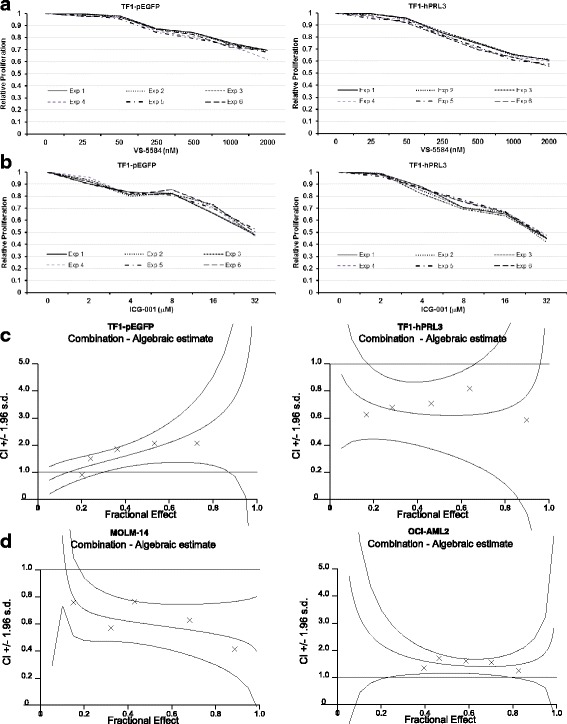
Cell proliferation assay analysis of VS-5584, ICG-001 monotherapy, and combination treatments on AML cell lines. TF1-pEGFP and TF1-hPRL3 cells were incubated with either DMSO control or increasing concentration of VS-5584 (a) and ICG-001 (b) for 48 h, followed by CTG assays. The treated results were shown in percentage after normalization with their DMSO control (100%), respectively (n = 6, mean ± SD). c TF1-pEGFP and TF1-hPRL3 cells and d MOLM-14 and OCI-AML2 cells were treated for 48 h with either single agent (VS-5584 or ICG-001 alone) or in combination at the indicated concentrations. Cell viability was then analyzed by CTG assays (n = 3, mean ± SD). These isobolograms of combination index (CI) for combination of VS-5584 and ICG-001 were generated by CalcuSyn software. A straight dot line represents an additive affect, where CI = 1. Any CI value which falls below this line is less than 1, indicating synergistic effect from the two drug combination. Antagonism is implied by CI > 1, where points are located above the dot line
