Fig. 3.

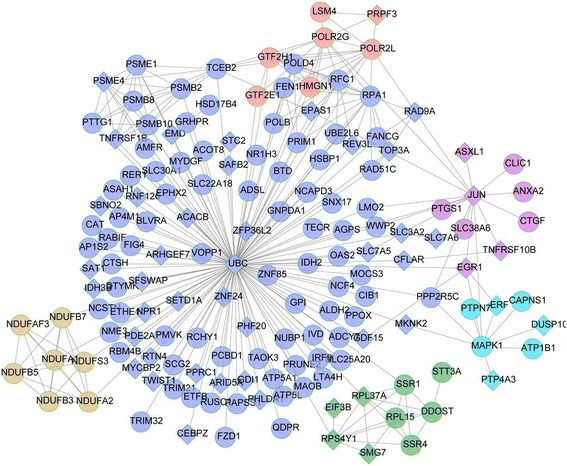
Significant network modules. The circle indicates upregulated DEGs, and the rhombus indicates downregulated DEGs. The different colors indicate different modules

Significant network modules. The circle indicates upregulated DEGs, and the rhombus indicates downregulated DEGs. The different colors indicate different modules