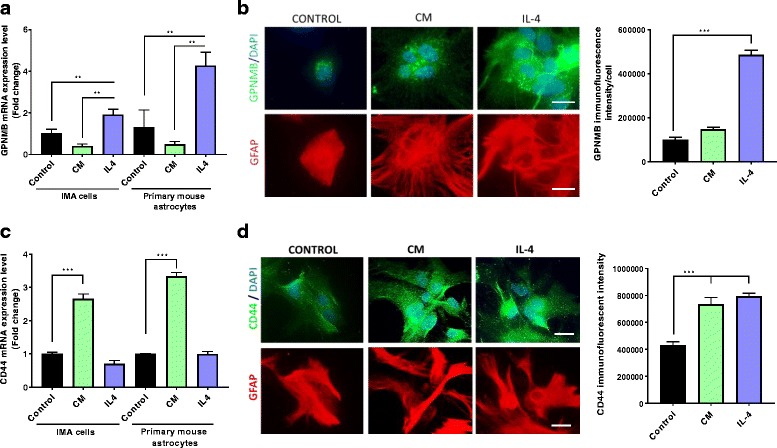
Fig. 2.

Increased GPNMB and CD44 in cultured astrocytes exposed to different stimuli. a–b GPNMB gene expression (a) in cultured IMA2.1 cells and PMAs by qPCR, and protein levels (b) by immunofluorescent microscopy in PMAs (GPNMB in green, DAPI in blue, and GFAP in red). c CD44 gene expression in IMA2.1 cells and PMAs treated with or without the inflammatory cytokine mix (CM) or recombinant IL-4. d Immunofluorescence images for CD44 (green) protein levels in GFAP-positive (red) primary mouse astrocytes following CM or IL-4 treatment (scale bar 20 μm). Asterisks denote statistically significant differences between CM or IL-4 treatment and control (**p < 0.01 and ***p < 0.001)
